UNIVERSITÀ DELLA CALABRIA
Dipartimento di Ingegneria Informatica, Modellistica, Elettronica e Sistemistica
Scuola di Dottorato
Scienza e Tecnica “Bernardino Telesio” XXVIII CICLO
Con il contributo della Regione Calabria
Programma Operativo Regionale (POR) Calabria - FSE 2007/2013 Asse V - Obiettivo Operativo N. 4 (Progetto RISPEISE)
SEISMIC VULNERABILITY ASSESSMENT OF CLASSES
OF REINFORCED CONCRETE STRUCTURES
Settore Scientifico Disciplinare ICAR/08
Direttore: Ch.mo Prof. Roberto Bartolino
Supervisore: Ch.mo Prof. Raffaele Zinno
To my Family To the Life that will come!
Seismic vulnerability assessment of classes
of reinforced concrete structures
Valutazione della vulnerabilità sismica
di classi di edifici in c.a.
La presente tesi è cofinanziata con il sostegno della Commissione Europea, Fondo Sociale Europeo e della Regione Calabria.
L’autore è il solo responsabile di questa tesi e la Commissione Europea e la Regione Calabria declinano ogni responsabilità sull’uso che potrà essere fatto delle informazioni in essa contenute
Abstract
Abstract
The modern seismic design is based on the concept to meet different performance levels, for each of which the structure should not exceed the predetermined degrees of damage.
The analysis of elastic-linear benefit from the simplicity of use and theoretical understanding, but are not able to predict the inelastic deformation capacity offered by a structure, for that reason they are unsuitable for a modern seismic design (based on the concept of performance), where the non-linear behavior and the conditions close to the collapse are investigated.
To achieve an accurate and realistic prediction of the seismic response of a structure is necessary to have analytical tools that allow to figure out the nonlinear behavior and its evolution over time.
The IDA, the Incremental Dynamic Analysis (designed by Prof. D. Vamvatsikos - foreign tutor's writer - and Professor C. A. Cornell), addresses the need to want to investigate the dynamic behavior of a structure at various levels of seismic intensity. Given an accelerogram, different dynamic analyzes on the same structure but with a seismic increasingly scaled input are performed, up to the collapse of the structure or until a predetermined level of deformation or displacement takes place.
The incremental dynamic analyzes are clearly preferable like nonlinear analysis, because only with the previous is possible to grasp the dynamic behavior of the structure resulting in potential savings in terms of actions to be pursued.
This is the concept on which is based the study carried out during this period: the evaluation of seismic vulnerability, especially of reinforced concrete structures, using the analysis above described.
Abstract Very significant and useful for the purpose of the research was the period spent abroad, during which a probabilistic and a statistical technique to assess losses caused by earthquakes of entire urban areas was developed.
The used approach is "multi-level", for classes of buildings that represent the building types that are in the examined area.
The starting point was the observation of an area inside the City Hall of Zografou, the district within which the NTUA (National Technic University of Athens) is located, by detecting some significant features of 305 surveyed buildings (such as number of floors, irregularities in height and in plant, year of construction). Each of these characteristics has been considered as discriminatory for the belonging of the particular building to a specific group. Homogeneous groups were then treated with techniques of statistical type, including the Clustering method, by which the number of the models (12 models) is resulted much lower than the number of the buildings analyzed, representative of the structures present in the whole area examined. Taking as a reference the legislation in force at time of the construction of each model to designing it (making choices about the statistical characteristics of the materials used), the results related to static analysis and IDA, have been considered for the assessment of seismic losses the whole area they represent.
The approach based on "damage factor" compared to other models for which are known seismic losses, led to further evaluation in terms of statistical dispersion of results.
The steps are repeatable, with the necessary precautions, in other areas, and they give the opportunity to describe the seismic fragility of the heritage of entire cities. The results are useful to provide valuable information to organizations such as the Civil Protection and / or insurance agencies.
Abstract
Abstract
La moderna progettazione antisismica è basata sul concetto di soddisfare diversi livelli di prestazione, per ognuno dei quali la struttura non deve superare dei prestabiliti gradi di danneggiamento.
Le analisi elastiche-lineari godono della semplicità di utilizzo e comprensione teorica, ma non sono in grado di prevedere la capacità di deformazione inelastica offerta da una struttura, per tale motivo risultano inadatte per una moderna progettazione antisismica (basata sul concetto prestazionale), dove si vogliono indagare i comportamenti non-lineari e le condizioni prossime al collasso.
Per ottenere una previsione accurata e realistica della risposta sismica di una struttura è necessario disporre di strumenti di analisi che permettano di coglierne il comportamento non lineare e la sua evoluzione nel tempo.
L’IDA, l’Incremental Dynamic Analysis (ideata dal Prof. D. Vamvatsikos - Tutor estero della scrivente – e dal Prof. C. A. Cornell), nasce dalla necessità di voler indagare il comportamento dinamico di una struttura a diversi gradi di intensità sismica. Per fare ciò, dato un accelerogramma, si svolgono diverse analisi dinamiche sulla stessa struttura ma con un input sismico di volta in volta scalato in maniera crescente, fino a raggiungere il collasso della struttura o un prefissato livello di deformazione o spostamento.
Le analisi dinamiche incrementali sono sicuramente da preferire come analisi di tipo non lineare, in quanto solo con queste si riesce a cogliere il comportamento dinamico della struttura con conseguente potenziale risparmio in termini di interventi da effettuare.
Abstract Proprio quest’ultimo è stato il concetto su cui si è basato lo studio svolto durante questo percorso: la valutazione della vulnerabilità sismica, in particolar modo delle strutture in c.a., utilizzando le analisi sopra specificate.
Molto significativo e utile ai fini della ricerca è stato il periodo trascorso all’estero, durante il quale si è messa a punto una tecnica probabilistica e di tipo statistico per valutare le perdite derivanti da fenomeni sismici di intere aree urbane.
L’approccio utilizzato è stato di tipo “multi-livello” su classi di edifici rappresentative di tipologie edilizie effettivamente presenti sul territorio.
Si è partiti dall’osservazione di un’area interna al Municipio di Zografou, il distretto entro il quale ricade la NTUA (National Technic University of Athens), rilevando alcune significative proprietà dei 305 edifici oggetto dell’indagine (quali numero dei piani, irregolarità in altezza e in pianta, epoca della costruzione). Ciascuna di queste caratteristiche è stata presa in considerazione come discriminante per l’appartenenza del particolare edificio ad uno specifico gruppo. I gruppi omogenei sono poi stati trattati con tecniche di tipo statistico, tra le quali il metodo Clustering, grazie al quale si sono ottenuti i modelli in numero nettamente inferiore agli edifici analizzati (12 modelli), rappresentativi delle strutture presenti nell’intera area esaminata. Tenendo come riferimento la legislazione vigente al tempo della costruzione di ciascun modello e progettando quest’ultimo in sua conformità (operando scelte di tipo statistico sulla scelta delle caratteristiche dei materiali utilizzati), i risultati relativi ad analisi statiche non lineari e analisi di tipo IDA, sono state considerate alla base della valutazione delle perdite sismiche dell’intera area che rappresentano.
L’approccio basato sul “fattore di danno” rispetto ad ulteriori modelli per i quali sono note le perdite sismiche, ha condotto ad un’ulteriore valutazione statistica in termini di dispersione dei risultati.
I passaggi adoperati sono ripetibili, con i dovuti accorgimenti, in altre zone, con la possibilità di descrivere la fragilità sismica del patrimonio di intere città e i cui risultati
Abstract sono utili a fornire valide informazioni ad enti quali la protezione Civile e/o agenzie assicurative.
Contents i
Contents
Introduction ... 1 1 Seismic risk ... 3 1.1 Introduction ... 31.2 Hazard, exposure and vulnerability risk: definition and interrelations ... 5
1.3 PBEE Methodology ... 6 1.3.1 PEER approach ... 8 1.3.1.1 Hazard Analysis ... 9 1.3.1.2 Structural Analysis ... 10 1.3.1.3 Damage Analysis ... 11 1.3.1.4 Loss Analysis ... 11 1.3.1.5 Decision Making ... 12
2 Vulnerability assessment methods ... 13
2.1 Introduction ... 13
2.2 Vulnerability Evaluation ... 14
2.3 Vulnerability procedure paths ... 16
2.4 Individual and class vulnerability ... 17
2.4.1 Individual Building Vulnerability ... 17
2.5 Damage Probability Matrix ... 19
Contents
ii
3 Seismic Analysis ... 23
3.1 Introduction ... 23
3.2 Nonlinear Static Analysis ... 24
3.2.1 Pushover Analysis ... 25
3.3 Nonlinear Dynamic Analysis ... 29
3.3.1 Incremental Dynamic Analysis (IDA) ... 30
3.3.1.1 Methodology ... 32
3.3.1.2 IDA curves properties ... 35
3.3.2 Achievement of performance levels according to FEMA ... 37
3.3.3 SPO2IDA tool ... 41
4 Large Scale Modelling ... 44
4.1 Introduction ... 44
4.2 Focus Area ... 44
4.2.1 Zografou Area ... 45
4.2.1.1 Location and historical notes about Zografou ... 45
4.2.1.2 Housing Schemes ... 46
4.2.1.3 Statistical information ... 48
4.3 Definition of building characteristics ... 51
4.3.1 Greek seismic code ... 52
4.3.2 Regularity definition ... 55
4.3.2.1 Regular buildings in plan ... 55
4.3.2.2 Regular buildings in height ... 56
4.4 Data mining process ... 57
4.5 The knowledge extraction process ... 59
Contents
iii
4.5.1.1 Distribution Methods ... 60
4.5.1.2 Hierarchical Methods ... 61
4.5.2 Clustering Models ... 63
4.5.2.1 First step: hierarchical by hand ... 63
4.5.2.2 Second Step: Clustering ... 64
4.5.2.3 Third step: Clusters Optimization ... 70
4.5.2.4 Obtained Models ... 71
5 Structural Design and Modelling of the structures ... 72
5.1 Introduction ... 72
5.2 Features of the Models ... 72
5.3 Buildings form and irregularity ... 76
5.4 Structural Design and Modelling of the Structures ... 78
5.4.1 Results of Modelling ... 81
5.5 Adaptation of the Models ... 85
5.5.1 Adapted Model 1 ... 87 5.5.2 Adapted Model 2 ... 89 5.5.3 Adapted Model 3 ... 91 5.5.4 Adapted Model 4 ... 93 5.5.5 Adapted Model 5 ... 95 5.5.6 Adapted Model 6 ... 97 5.5.7 Adapted Model 7 ... 99 5.5.8 Adapted Model 8 ... 101 5.5.9 Adapted Model 9 ... 103 5.5.10 Adapted Model 10 ... 105 5.5.11 Adapted Model 11 ... 107
Contents iv 5.5.12 Adapted Model 12 ... 109 6 Results ... 111 6.1 Introduction ... 111 6.2 Model 1 ... 111 6.3 Model 2 ... 113 6.4 Model 3 ... 114 6.5 Model 4 ... 116 6.6 Model 5 ... 117 6.7 Model 6 ... 119 6.8 Model 7 ... 120 6.9 Model 8 ... 122 6.10 Model 9 ... 123 6.11 Model 10 ... 125 6.12 Model 11 ... 126 6.13 Model 12 ... 128 7 Conclusions ... 130 Bibliography ... 132
Introduction
1
Introduction
The present work has the final objectives of performing in probabilistic terms a seismic vulnerability evaluation of classes of reinforced concrete existing buildings, which were designed and built before or after the application of modern seismic codes.
An evaluation procedure that is based on a survey carried out through the typological census of part of the estate to a quite pushed level of detail (to satisfactorily characterize building types in the area under investigation), is presented.
A simplified method for seismic vulnerability assessment allows the repeatable transition from general to particular urban contexts. The investigated structures (like the matching results), are representative samples of buildings that rise in specific area of cities.
After the practical data collection (in absence of appropriate buildings census), the meaningful properties in seismic terms of constructions are processed through clustering and tidying procedures.
The derived models (whose number is very lower than the initial number of buildings taken into account), are “re-designed” using the seismic code in force at the time of construction. Selection and initial dimensioning, design to the particular code, modeling, inelastic SPO analysis of the obtained models are based on the results of Zeris et al. [2005].
To estimate IDA curves from the results of SPO for each models, the tool SPO2IDA has been used.
In the single building vulnerability study, get to a detail level that permits the evaluation of seismic behavior of various factors (possible collapse mechanism, different characteristics of the construction materials, etc.), is possible.
Introduction
2
In case in which the building is representative of a class, it represents the 'average' (the model) of a identified type in terms of macro parameters morphological / structural (plan dimensions, number of floors, period of construction, etc. ) which describes the variation of all the buildings of a class.
In this work, the above-mentioned method for seismic vulnerability assessment is applied to Zografou area, one of the suburb in the eastern part of Athens agglomeration, where there is also the Campus of the National Technical University of Athens (NTUA).
Cap. 1 Seismic risk
3
Seismic risk
1.1 Introduction
The earthquake is a dangerous event that has often resulted in the destruction of or damage to property and / or leading to a significant loss of life.
This is surely one of the damaging events generated by natural forces, it is the most feared by man because of the large number of casualties it causes, in particular, from the statistics of natural disasters and man-show that is actually the major cause of loss of lives.
Certainly, the scale of a natural disaster depends not only from the elements, but also by factors of human relevance, such as the construction techniques or the quality of the preventive measures in the affected region.
For this reason, to determine the impact that future earthquakes could have on the buildings in a given region is referred to the evaluation of the "seismic risk" which requires separate analysis of three basic components:
- the "hazard",
- the "vulnerability" and the - '"exposure"
Cap. 1 Seismic risk
4
The earthquake risk in a certain timeframe, is the provision of social and economic losses expected as a result of the occurrence of an earthquake estimated for the reference area during this time interval.
Following this approach the dangerousness (or "hazard"), expresses the probability of occurrence of a physical process or event that can cause loss of life and property; the vulnerability expresses the quantity of resources to be lost in relation to the event; exposure represents the value of the resources at risk. Defined as the risk is understandable that the occurrence of a catastrophic event in the desert, for example, carries a risk close to zero since the property at risk are almost zero (exposure).
In the case of buildings, the seismic vulnerability of a building is its susceptibility to being damaged by an earthquake and it can be expressed "by all the probability of achieving a series of damage levels up to the collapse, evaluated according to the seismic intensity and its occurrence"(Augusti and Ciampoli, 1999). Therefore the vulnerability of a building should be defined by a probabilistic relationship between intensity and level of damage, in operational terms, a vulnerability analysis has to assess the damage caused by earthquakes of various intensities.
Defined these three terms, establish whether the study is performed as a preventive measure (risk analysis) or for emergency management (scenario analysis) is necessary. The choice between risk analysis and scenario analysis depends on the purpose of the study; established the goal, for the vulnerability study, also the approach changes: it is probabilistic for risk analysis, deterministic for scenario analysis.
Cap. 1 Seismic risk
5
1.2 Hazard, exposure and
vulnerability risk: definition and
interrelations
The risk is defined, in general, as the probability that as a result of a certain event, a given functional system (a person or a community, a building or a complex of buildings, a settlement or a region), in the course of an assigned period of time (a year, the nominal life of the system), suffers damage (mechanical, functional), and derive from these losses to a community (those in the system, the inhabitants of a region or a nation, a class) regarding certain resources (human lives, health, standards, economic goods, cultural values).
The risk can be expressed as the convolution of the hazard, exposure and
vulnerability.
The seismic risk, in particular, represents the probability that a structure (a functional system) exceeds a predetermined limit state (damage) due to an earthquake (event) during an assigned time period. This definition is the transposition to the field of earthquake engineering, of the more general concept of reliability of a system. Therefore the seismic risk is the complement to one of the reliability of the structural system in the observation period.
As for the damage, it is necessary to differentiate the damage to people and damage to structures. To reduce the risk within reasonable limits, it should be subject to at least two different design conditions:
- Damage Limit State: structures must be designed to withstand in elastic field, stresses induced by the event whose intensity corresponds, with reference to the characteristics of the area in question, for a return period
Cap. 1 Seismic risk
6
of the order of nominal life of the structure (in the case of earthquakes is assumed in general for normal buildings for housing, a return period of 50 years);
- Ultimate Limit State: the structures have to have sufficient reserves of strength, over the elastic limit, to tolerate without collapsing the actions of an event of such intensity as to suggest extremely unlikely the occurrence of an event of greater intensity. The event which has to be considered in this second design condition is therefore characterized by a return period of 475 years.
The first condition is especially directed to limit the damage to the buildings, while the second condition makes clear reference to the Safety of Life.
1.3 PBEE Methodology
1
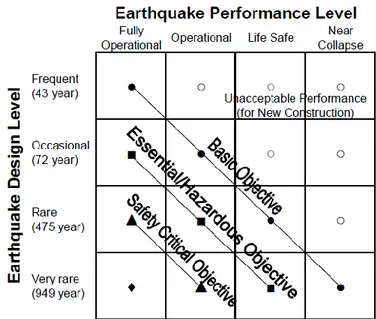
PBEE attempts to address performances primarily at the system level in terms of risk of collapse, fatalities, repair costs, and post-earthquake loss of function. Initial efforts to frame and standardize PBEE methodologies produced SEAOC’s Vision 2000 report (1995) and FEMA 273 (1997), a product of the ATC-33 project. The authors of these documents frame PBEE as a methodology to assure combinations of desired system performance at various levels of seismic excitation. The system-performance states of Vision 2000 include fully operational, operational, life safety, and near collapse.
1 “An Overview of PEER’s Performance-Based Earthquake Engineering Methodology” – K. A .Porter, Ninth International Conference on Applications of Statistics and Probability in Civil Engineering (ICASP9) July 6-9, 2003, San Francisco.
Cap. 1 Seismic risk
7
Levels of excitation include frequent (43-year return period), occasional (72-year), rare (475-year) and very rare (949-year) events. These reflect Poisson-arrival events with 50% exceedance probability in 30 years, 50% in 50 years, 10% in 50 years, and 10% in 100 years, respectively. The designer and owner consult to select an appropriate combination of performance and excitation levels to use as design criteria, such as those suggested in Fig. 1.1.
FEMA 273 expresses design objectives using a similar framework, although with slightly different performance descriptions and levels of seismic excitation. Each global performance level is detailed in terms of the performance of individual elements. A design is believed to satisfy its global objectives if structural analysis indicates that the member forces or deformations imposed on each element do not exceed predefined limits.
Performance is binary and largely deterministic: if the member force or deformation does not exceed the limit, it passes; otherwise, it fails.
Fig. 1.1: Vision 2000 recommended seismic performance objectives for buildins (after SEAOC, 1995)
If the acceptance criteria are met, the design is believed to assure the performance objective, although without a quantified probability.
Other important pioneering PBEE efforts include ATC-32 (1996a), ATC-40 (1996b), and FEMA 356 (2000).
Cap. 1 Seismic risk
8
1.3.1 PEER approach
The Pacific Earthquake Engineering Research (PEER) Center, based at the University of California, Berkeley, is one of three federally funded earthquake engineering research centers.
A central feature of PEER’s approach is that its principal outputs are system-level performance measures: probabilistic estimates of repair costs, casualties, and loss-of-use duration (“dollars, deaths, and downtime.”).
The objective of the methodology is to estimate the frequency with which a particular performance metric will exceed various levels for a given design at a given location. These can be used to create probability distributions of the performance measures during any planning period of interest. From the frequency and probability distributions can be extracted simple point performance metrics that are meaningful to facility stakeholders, such as an upper-bound economic loss during the owner-investor’s planning period.
Cap. 1 Seismic risk
9
Fig. 1.2: PEER analysis Methodology
PEER’s PBEE approach involves four stages (Fig. 1.2): - hazard analysis,
- structural analysis, - damage analysis, - loss analysis.
1.3.1.1
Hazard Analysis
In the hazard analysis, one considers the seismic environment (nearby faults, their magnitude-frequency recurrence rates, mechanism, site distance, site conditions, etc.) and evaluates the seismic hazard at the facility considering the
Cap. 1 Seismic risk
10
facility location and its structural, architectural, and other features (jointly denoted by design, D), to produce the seismic hazard, g[IMgD].
The hazard curve describes the annual frequency with which seismic excitation is estimated to exceed various levels. Excitation is parameterized via an intensity measure (IM) such as Sa(T1), the damped elastic spectral acceleration at the small-amplitude fundamental period of the structure. In our analyses to date, the hazard analysis includes the selection of a number of ground-motion time histories whose IM values match three hazard level of interest, namely, 10%, 5%, and 2% exceedance probability in 50 years.
PEER researchers have used Sa so far in our analyses, and have established procedures to select design ground motions consistent with the site hazard (e.g., Somerville and Collins, 2002). We will also test nine alternative IMs (see Bray, 2002, for a list) that might estimate performance with less uncertainty. We will test each IM for conditioning on magnitude, distance, and possibly other parameters that might relate to performance. (These are the efficiency and sufficiency tests described by Luco and Cornell, 2001). Most of the candidate IMs are scalars; some are vectors (e.g., Pandit et al., 2002). Some are more relevant to excitation of structures (e.g., Cordova et al., 2001), while some focus on ground failure (Kramer and Mitchell, 2002).
1.3.1.2
Structural Analysis
In the structural analysis, the engineer creates a structural model of the facility in order to estimate the uncertain structural response, measured in terms of a vector of engineering demand parameters (EDP), conditioned on seismic excitation and design (p[EDP|IM,D]).
EDPs can include internal member forces or local or global deformations, including ground failure (a preliminary list is provided in Porter, 2002). The structural analysis might take the form of a series of nonlinear time-history structural analyses. The structural model need not be deterministic some PEER analyses have included
Cap. 1 Seismic risk
11
uncertainty in the mass, damping, and force-deformation characteristics of the model
1.3.1.3
Damage Analysis
EDP is then input to a set of fragility functions that model the probability of various levels of physical damage (expressed via damage measures, or DM), conditioned on structural response and design, p[DM|EDP,D].
Physical damage is described at a detailed level, defined relative to particular repair efforts required to restore the component to its undamaged state. Fragility functions currently in use give the probability of various levels of damage to individual beams, columns, nonstructural partitions, or pieces of laboratory equipment, as functions of various internal member forces, story drift, etc. They are compiled from laboratory or field experience. For example, we have compiled a library of destructive tests of reinforced concrete columns (Eberhard et al., 2001). The result of the damage analysis is a probabilistic vector of DM.
1.3.1.4
Loss Analysis
The last stage in the analysis is the probabilistic estimation of performance (parameterized via various decision variables, DV), conditioned on damage and design p[DV|DM,D].
Decision variables measure the seismic performance of the facility in terms of greatest interest to stakeholders, whether in dollars, deaths, downtime, or other metrics. Our loss models for repair cost draw upon well-established principles of construction cost estimation. Our model for fatalities, currently in development, draws upon empirical data gathered by Seligson and Shoaf (2002) and theoretical considerations elaborated by Yeo and Cornell (2002). Later research will address injuries.
Cap. 1 Seismic risk
12
1.3.1.5
Decision Making
The analysis produces estimates of the frequency with which various levels of DV are exceeded. These frequencies can be used to inform a variety of risk-management decisions.
If one performs such an analysis for an existing or proposed facility, one can determine
whether it is safe enough or has satisfactorily low future earthquake repair costs. If one re-analyzes the same facility under redesigned or retrofitted conditions, one can assess the efficacy of the redesigned facility to meet performance objectives, or weigh the reduced future losses against the upfront costs to assess the cost-effectiveness of the redesign or retrofit. For example, if one refers to the reduction in the present value of future losses as benefit (B) then the expected benefit during time T of a retrofit measure that changes the design of a facility from D to D’ can be calculated as
Cap. 2 Vulnerability Assessment Methods
13
Vulnerability
assessment methods
2.1 Introduction
A qualitative definition of seismic vulnerability, that can be widely accepted, is as follows: the proneness of some category of elements at risk to undergo adverse effects inflicted by potential earthquakes. This kind of definition, which is definitely vague, requires of course considerable refinements in order to become an operational tool for various purposes, like estimate of seismic risk, development of earthquake scenarios, or development of strategies of risk mitigation. The concept of vulnerability pertains to a system of basic concepts involved in risk analysis.
Vulnerability assessment of existing buildings is an issue of major importance to the territory like Italy and Greece, where much of the built heritage was not erected according seismic criteria. The study of this problem is important for the determination of the safety level of these structures after a seismic event, in order to carry out studies of scenario by identifying buildings at greater risk on the territory and to plan interventions useful to the restoration of security, and also to address first post earthquake aid towards the most vulnerable areas.
Cap. 2 Vulnerability Assessment Methods
14
2.2 Vulnerability Evaluation
We could distinguish three types of seismic vulnerability:- Direct vulnerability, which determines the propensity of a single physical element or complex to suffer damages due to an earthquake;
- Generated vulnerability, which it is defined according to the crisis that is induced by the collapse of a single or complex physical element;
- Delayed vulnerability, which specifies the effects that occur in the later stages to the earthquake and during the first emergency. This work refers to the first kind of vulnerability that relates directly to one side the seismic action, and on the other hand, the damage that it causes the physical system.
The first issue to be dealt is the choice of the parameter that can identify these variables.
As far as concerned the seismic action, we could consider different possibilities, like the macroseismic intensity that represents a very useful parameter because of its direct correlation of the intensity scale with the earthquake damages. However, this choice is not so convenient in terms of structural damage assessment, because it is difficult connect it whit the spectral values, that allow to define the risk. The use of spectral quantities is more advisable, because these offer also the possibility to evaluate the damage in a structural analysis since they have a clear mechanical meaning.
The damage, instead, is generally expressed by economic cost or indexes. In the first case, the cost is expressed as a cost necessary for the recovery of the construction and in general this cost is related to the value of new construction; in
Cap. 2 Vulnerability Assessment Methods
15
the latter, indexes can be used in qualitatively or quantitatively ways, but they always require a standardized scale and subsequent correlation to the economic value, in sense that in every case the total damage of the building is necessary to express through a single indicator that is easily convertible in economic terms.
In the last three decades, various methodologies for estimating the vulnerability have been developed and their classification task is far from simple.
The methodological paths that we could follow are varied, and the choice of one or the other depends primarily on the size of the sample analyzed, as well as the availability of information or by the relative difficulty of finding its, and by the objectives of the analysis of vulnerability that we are running and the disposable income and time that we want.
A first essential distinction, therefore, should be made according to the size of the sample for which we want to assess the vulnerability; in theory, in fact, it is possible to evaluate the vulnerability of a single building, as well as a class of buildings shared the same typical features, or by widening the area of investigation, a neighborhood, a city, a land area even wider, etc.. Of course the basic information that are essential to the performance of the analysis will vary from case to case, as well as, necessarily, the investigation methods and the reliability of results that it is hoped to achieve have to be vary.
Cap. 2 Vulnerability Assessment Methods
16
2.3 Vulnerability procedure paths
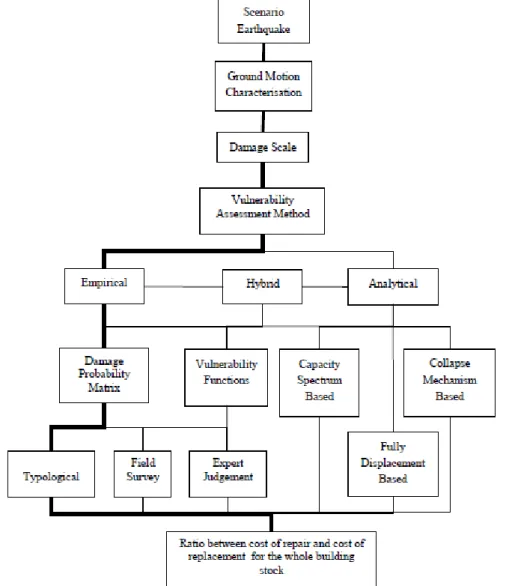
The various methods for vulnerability assessment that have been proposed in the past for use in loss estimation can be divided into two main categories: empirical or analytical, both of which can be used in hybrid methods2 (see Fig. 2.1).Fig. 2.1: The components of seismic risk assessment and choices for the vulnerability assessment procedure (the bold path shows a traditional assessment method
Calvi et al. presented some of the most important methods of vulnerability assessment that over time have been adopted, highlighting each the methodology.
Cap. 2 Vulnerability Assessment Methods
17
2.4 Individual and class
vulnerability
The attention in this study is focused on vulnerability assessment of classes of buildings, so to pass from the particular to the general, the estimation of vulnerability of a single building is discussed, and then the eventual determination of the relative fragility curves, by framing the study on an analysis of type reliability front, is presented.
Traditionally, the study of the seismic behavior of a individual building is not considered as a vulnerability analysis, although it may provide a measure of the damage that a structure may suffer as a result of the seismic phenomenon. The study of the detail of the individual case requires input information on the mechanical and geometrical characteristics of the building and a very accurate computational cost such as to justify its use only in those cases in which a sufficiently approximate estimate of the degree of construction safety is desired, as for buildings of strategic importance or intrinsic historical/monumental value.
2.4.1 Individual Building Vulnerability
The study of the vulnerability of each building involves, theoretically, the degree of damage estimated expected for each level of seismic intensity. The conceptually clearer way, and also the most complete, to perform this estimate is to build the fragility curves for the particular structural investigated system. In general, a fragility curve of a building represents, on the basis of the variation of seismic intensity, the probability that the building reaches a particular limit state. In mathematical terms this is expressed by the function of conditional probability P
Cap. 2 Vulnerability Assessment Methods
18
[SL|I] in which SL|I expresses the attainment of a limit state (that of predetermined damage thresholds) for the value of seismic intensity I, which may be represented by the PGA, PGV, spectral acceleration etc. depending on the purposes of the considered case. For each building, of course, building more fragility curves is possible, each corresponding to a predetermined limit state. An example of fragility curves constructed on the basis of the peak ground acceleration (PGA), as the parameter of seismic intensity, is shown in Fig. 2.2, where two fragility curves obtained for the same structural system are represented simultaneously and they are corresponding, each, to achieve a different limit state (Light Damage, Life Safety).
Fig. 2.2: Building fragility curve
By definition, the study of vulnerability of buildings provides to give the estimate of the degree of expected damage in probabilistic measure, in relation to type of analyzed structure and considered seismic intensity.
It should be underlined that the analysis of a single building is different from the analysis of a building that represents other constructions.
In the study of the vulnerability of the individual building, push to a level of detail that evaluates the influence of various factors on the seismic behavior is possible (particular failure mechanisms, characteristics of building materials, etc.). In case of representative of a class building, instead, it constitutes an average building of a typology of constructions identified in terms of macroelements (kind of structure, shape, plan dimension, number of floors, construction period, etc., defines
Cap. 2 Vulnerability Assessment Methods
19
the description of a category). The influence on the seismic response of the macroscopic parameters in an analytical approach is difficult to take into account, so for one category, the fragility curves are built empirically, ie by statistically treating the observed data on the degree of damage sustained as a result of earthquakes for buildings referable to the same typological class.
The single building study can be addressed through a mechanic/analytical approach. When the damage degree dependent of the seismic input (then the fragility) is evaluated by numeric seismic simulation, the fragility curves are analytically obtained. The computational and modelling cost is very high, so the analytical fragility curves construction is legitimized only for very important building cases (strategic or monumental importance) or for scientific research purpose.
2.5 Damage Probability Matrix
The Damage probability Matrix (DPM) are matrix generated to buildings categories and they express the probability that a certain level of damage for each seismic intensity occurring. Theoretically, therefore, they can be constructed by referring to a generic scale of damage, whether expressed in terms of costs (eg as the ratio of the cost of repair on the cost of reconstruction), both in phenomenological terms, that is, on the basis of a qualitative evaluation of the different degree of damage that buildings can have.
For example, the MSK-76 scale (Medvedev, 1977) is the first model of Damage Probability Matrix (also if it is not complete). In this scale three classes of different construction typology are presented: unit A defines stones construction, bricks building are in unit B, and reinforced construction are in unit C. The seismic intensity is based through the damage scenarios that there are in the territory: the damage level has six degrees (Table 2.1).
Cap. 2 Vulnerability Assessment Methods
20
Table 2.1: MSK76 damage levels
Damage Description
0 No damage
1 Slight Damage: thin cracks and fall of small pieces of plaster
2 Average Damage: small cracks in walls, fall of substantial portions of plaster, cracks in chimneys and part of its falls
3 High Damage: formation of large cracks in the walls, chimneys fall 4 Destruction: gaps between the walls, the possible collapse of portions of
buildings, separate parts of the building are out, collapse of interior walls 5 Total Damage: total collapse of the building
The MSK scale has twelve seismic intensity levels: the first four are associated with phenomenological aspects that concern the soil (without damages on the constructions) and MSK scale repeats the content of MCS scale in terms of seismic intensity. From the fifth to the tenth degree, instead, the earthquake intensity is associated with the entity of the structure damages, through rates and parts of damaged constructions.
The MSK scale has some limits: it does not take in account of the particular and modern construction typologies and the data are very coarse: not every damage levels are considered.
2.6 Building Class Approach
The building class approach studies scenario investigations. it allows to assess the vulnerability of the built in a given area in relation to any seismic event.
Cap. 2 Vulnerability Assessment Methods
21
The typological classification of the buildings is based on surveys conducted specifically in the area of study and reflects in more faithful way the actual characteristics of the investigated building heritage. This implies a greater investigative cost, especially at the beginning of the territorial survey, but it allows to have more reliable results because the used structural models for the analysis are calibrated to the constructive classes that exist in the area.
The evaluation of the seismic capacity of classes of buildings takes place in expeditious manner and with relatively simplified calculation models ('typological' models). For each identified building class in the area, then, one or more detail models are constructed. They constitute means of verification and calibration of the 'typological' models and they are connection to the assessment of the vulnerability in relation to the considered seismic input. Thus, the required information in input are mainly aimed at the construction of representative models of buildings: information about geometric and constructive characteristics that affect the seismic behavior are gathered.
The geographical area in which to report the study can not be too large (citywide surveys) unless the structures are not of considerable homogeneity in the territory or the researcher has sufficient resources to allow more measurements in large areas. The input data can be obtained by integrating different cognitive factors such as field surveys executed or specially made for other purposes but from which we are able to get enough information from those required, knowledge of the characteristics of strength and deformation of building materials actually used, all sorts of information derived from interviews, consulting projects, regulations etc., and the recurring design characteristics at the time of construction.
The statistical analysis of the information collected is used to define the typological classes recurring, differentiated by morphology geometrical / structural, period of construction, number of floors, height between floors, etc..
Cap. 2 Vulnerability Assessment Methods
22
For each detected class, then, a building “sample” is extracted: it has to be studied in greater detail and the characteristics that define the seismic behavior has to be punctually specified.
Several seismic analysis can be conducted on the representative building of each class and the seismic capacity will be studied in probabilistic terms so to obtain the class vulnerability.
Cap. 3 Seismic Analysis
23
Seismic Analysis
3.1 Introduction
The great scientific evolution that has taken place in recent years allows to design "safe" structures, able to satisfy the performance requirements. Nevertheless, most of the existing building is seismically vulnerable. Almost all of the buildings was built in a period when the economy was led by a "boom" building and knowledge of structures, materials and activities was very limited and not sufficiently supported by adequate normative bases in technical terms. Therefore, the problem related to the structural safety is actual and it affects both the scientific community and public administrations. Existing buildings have degradation and age problems, as well as being designed according to standards, design practices and structural engineering concepts very different from those that are currently understood and accepted. Following a seismic event, knowing the level of safety of these structures is important to carry out scenario studies (identifying riskier buildings on the territory and planning useful interventions to the restoration of security), and to direct emergency aid to the most vulnerable areas.
The modern seismic design is based on the concept to satisfy the various performance levels, for each of which the structure should not exceed the predetermined degree of damage. For this kind of design a nonlinear analysis is essential. Designers need a more extensive theoretical knowledge (especially when they have to perform dynamic analysis), involving more computational effort than the linear static analysis. The linear elastic analyzes are quite simple to perform, but
Cap. 3 Seismic Analysis
24
they are not able to predict the capacity of inelastic deformation that the structure offers, so they are unsuitable to a modern seismic design (based on the performance concept), where the nonlinear and near-collapse behavior should be investigated.
3.2 Nonlinear Static Analysis
In order to obtain an accurate and realistic prediction of the seismic response of a structure, have analysis tools that allow to capture the nonlinear behavior and its time evolution is necessary. The nonlinear dynamic analysis in step is undoubtedly the most comprehensive and effective tool (assuming that the structural model accurately reproduces the real system): the response of the structure is determined by step-by-step integration of the equations of motion of a system with nonlinear multi degrees of freedom (MDOF).
The following points hinder a widespread use in professional practice:
- the choice of involved parameters is delicate and significantly influence the results of the same;
- to obtain statistically reliable results, numerous analyzes that use a discrete set of accelerograms (appropriately selected and not easily defined) must be conducted;
- the accuracy of the analysis runs counter to the simplicity and speed of execution;
- the results interpretation is complex and expensive.
An attractive alternative is to work non-linear static analysis procedures that, while maintaining remarkable ease of use and interpretation of the typical linear static analysis, allows more realistic and reliable estimate of the structural response in nonlinear field. Their application is becoming more common both to design and to verify the structures.
Cap. 3 Seismic Analysis
25
3.2.1 Pushover Analysis
The pushover analysis is a type of analysis that can evaluate the nonlinear seismic behavior of the building in different directions of seismic motion.
It consists in applying to the building gravity loads and a system of horizontal forces that by maintaining unchanged the relative proportions between the forces themselves, are all scaled so as to increase monotonically the horizontal displacement of a control point of the structure (usually a point on top of the building), until the achievement of the ultimate limit state.
The pushover analysis can be performed by applying to the structure a forces system or a displacements system.
Any increase in the loads, the structural strength is revalued and the stiffness matrix is updated in accordance with the achievement of the convergence continuing to limit state of damage or default to the collapse of the structure.
The analysis is repeated by changing the forces distribution on the height and direction of the forces, considering various angular scans for the earthquake. The resistant elements are considered to be elasto - plastic, with a limited ductility and the limit rotations at yield and collapse are measured, according to legislative indications.
In a nonlinear analysis, the keywords are: “demand”, “capacity” and “performance”. The demand is the measure of seismic ground motion, the effects of the soil on the structure or on the structural elements. It can be defined by the response spectra. The capacity is the ability of the structure and its structural elements to resist to the corresponding seismic demand. For the structure, it can then be represented by a curve that defines the global behavior, using a function of the structural response shear -displacement (pushover curve).
Cap. 3 Seismic Analysis
26
Fig. 3.1: Pushover curve
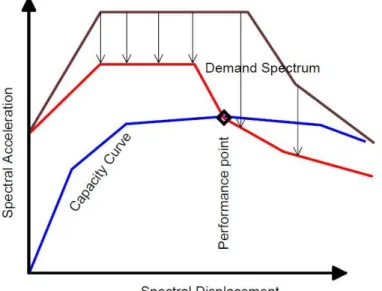
The performance represents the degree to which the capacity absorbs the demand. In other words, it indicates the real performance expected from the structure and it is obtained by the intersection of the capacity curve and the demand curve (Fig. 3.2). The final goal of the analysis is to check the position of the intersection point (performance point - PP) compared to a point that defines the limit state design. The structure has to have the ability to resist to the seismic demand so that the performance is compatible with the project objectives.
Fig. 3.2: Performance Point
The response analysis of the structure is connected to that of a system with single degree of freedom (SDOF), equivalent to the starting structure. The linear static methods allow to identify the maximum displacement of SDOF system and then also
Cap. 3 Seismic Analysis
27
the response of the structure (point performance) subject to a seismic event featured by its response acceleration spectrum.
The Fig. 3.1 shows the evolution of the structural response to the growing intensity of the vector of the applied equivalent static forces. We may notice that when the forces grow, the number of plastic hinges which is formed subsequently to the achievement of the elastic threshold (first hinge formation), increases up to the achievement of a configuration corresponding to exhaustion of the capacity of an element.
Summarizing, then, the force - displacement system curve typical of a ductile behavior, which reaches the collapse, is characterized by the following phases:
1. The (not yet damaged by the seismic action) structural system is subjected to the action of equivalent seismic forces that have a defined distribution. In this first phase, the applied forces system produces elastic system displacement but not plastic deformation.
2. The intensity of applied forces system increases until to determine a first section plasticization, when a yielding limit is reached.
3. The structure is pushed further, leading to progressive formation of other plastic hinges and further global damage. At the beginning of the 'i-th step of charging, the structure is mechanically modified than its initial configuration because some plastic hinges are present. This modified structure can also be subjected to the action of an updated system of equivalent seismic forces. The loading step will end when the multiplier of the increasing horizontal forces will cause a new plasticity.
4. The analysis ends in correspondence of the activation of a collapse mechanism determined by the achievement of a plasticization degree that generates lability in the structure (global collapse) or the attainment of limit conditions.
Cap. 3 Seismic Analysis
28
The analysis is applicable for new design buildings and for existing buildings. In the first case, the pushover analysis can be supported by a linear analysis based on the factor q, in function of the value of the effectively available overstrength ratio αu/α1.
In the latter, after the materials and the reinforcemet characterization, thanks to the the pushover analysis is possible to seismically verify the building, which can be analyzed in the actual state and in the state resulting after the application of reinforcements to assess the achievement of complete seismic upgrading or only to evaluate an improvement compared to their previous state. To the lateral forces system is given the task of reproducing the effects that result on the structure as a result of an earthquake, so the choice of the distribution of forces adopted makes it more or less valid the whole analysis.
The shape of all the profiles of the lateral loads reported in the design codes is fixed and it does not vary during the analysis. This is one of the main limitations of the non-linear static procedures: the real distribution of inertial forces changes continuously on a building during an earthquake, due both to the higher vibration modes than that for the structural degradation. To obviate these drawbacks, non-linear static procedures that consider the presence and interaction of different vibration modes of the structure (multimodal interaction) have been developed. Furthermore, in the more advanced methods, the simultaneous variability of the distribution of the lateral forces which grow with the multiplier of the loads (loads adaptivity) is considered. By the simultaneous presence of multimodality and adaptivity, nonlinear static analysis results tend to become closer to the nonlinear dynamic analysis results. In this way the accuracy of the solution improves. Antoniou S. and Pinho [2004] proposed advanced procedures called FAP (Force-based Adaptive Pushover) and DAP (Displacement-based Adaptive Pushover).
The reliability of the results obtained from the use of algorithms FAP and DAP has been extensively tested on plan structures, where both methods give good results. For spacial structures, the validation is still experimental, especially as it regards the structures with strong irregularities, in which the dynamic behavior is extremely
Cap. 3 Seismic Analysis
29
different from regular structures: torsional modes can dominate over those translational. In regular structures, the mass center (MC) coincides with the rigidity center (RC) and the validated classic pushover analysis for flat frame produced encouraging results, and also it applies to the spatial structures that are regular in plan and in height. When instead irregular structures are investigated (MC different from RC), serious torsional stiffness problems born. The predictions are incorrect, especially as regards the rotations of plane. The dynamic behavior of a spatial structure may be more complicated also because the translational vibration modes are coupled to the torsional modes. In these cases, a static analysis with difficulty captures the dynamic effects of the structure.
3.3 Nonlinear Dynamic Analysis
The design and seismic check of the buildings starts in most cases with analytical methods in which actions of the earthquake are represented in the form of response spectra, but some situations require fully dynamic analysis and the actions of the earthquake have to be represented in the form of time-history of acceleration. These situations include the safety design of critical structures, highly irregular buildings, or isolated structures designed for a high ductility degree. For such projects, the simulation of structural response conducted using one scaled elastic response spectrum of the structure factor is not appropriate, but a series of accelerograms adapted to the dynamic analysis is considered opportune.
The nonlinear dynamic analysis based on the use of accelerograms consist in to calculate the seismic response of the structure by means of direct integration (step-by-step) of the motion equations, using a nonlinear structure model. It has the purpose to assess the dynamic behavior of the structure in the non-linear range, allowing direct comparison between demand ductility and available ductility at each
Cap. 3 Seismic Analysis
30
step of load, as well as to verify the integrity of the structural elements in relation to possible plastic behaviors.
Unlike of the static analysis, nonlinear dynamic analysis does not require the prior definition of global seismic demand. In fact, the global shift demand is estimated during the modal analysis, which provides only to estimate the peak response (through methods of combining static SRSS and CQC); the dynamic analysis allows to accurately calculate the maximum seismic response. Against these advantages in terms of accuracy, there is the need to define the nonlinear behavior of the structure in a more comprehensive way, including even the most accurate description of the cyclic behavior. Furthermore, the response is very sensitive to the input data, the accelerograms have to be defined in a proper way and the computational effort is high. Despite these limited complications, the nonlinear dynamic analysis is certainly the method for more accurate calculation, since it allows to know the time evolution of various parameters of the structural response (displacements, strains, strength and stresses).
This analysis has gained increasing importance also because of the need to apply it to structures with base seismic isolation, which are protected by devices whose behavior has strong nonlinearity that do not follow standardized models.
3.3.1 Incremental Dynamic Analysis (IDA)
The Incremental Dynamic Analysis (IDA)3 is a structural analysis method that offers a
complete prevision of the seismic demand, using nonlinear dynamic analyzes and subjecting the building to different sets of accelerogram. It addresses the need to want to investigate the dynamic behavior of a structure to different levels of seismic intensity. To do that, given an accelerogram, different dynamic analyzes are
3 Vamvatsikos D., Cornell C.A. : “Direct estimation of the seismic demand and capacity of MDOF systems through Incremental Dynamic Analysis of an SDOF Approximation”. ASCE Journal of Structural Engineering, 131(4): 589-599, 2005
Cap. 3 Seismic Analysis
31
conducted on the same structure but with a different seismic input, each time the input is scaled in ascending order, up to the collapse of the structure or a fixed level of deformation or displacement (Fig. 3.3).
This type of analysis provides additional advantages over a single dynamic analysis: it allows to observe the evolution of the structural behavior of the building with increasing of the seismic forcing.
In particular, it is possible to understand
- how the structure reaches the crisis, - what kind of crisis is in place,
- where there are structural weaknesses, - where the first plastic hinges are formed, - what is the elastic behavior and post-yield,
- how the answer dynamic varies moving from linear to nonlinear behavior.
Cap. 3 Seismic Analysis
32
Fig. 3.3: IDA analysis results:
The efficiency of IDA is also confirmed by FEMA, that indicates it as the primary tool to determine the overall capacity of collapse of a structure.
3.3.1.1
Methodology
IDA was presented by D. Vamvatsikos and CA Cornell [2002]. It provides to subject the structure model to a series of accelerograms, each scaled by multiple levels of intensity.
In this way one or more response curves parameterized with the level of intensity are obtained.
The IDA is a widely applied method and it includes:
- the response or request range compared with the range of potential levels of ground motion;
- a better understanding of the structural implications due to earthquakes with levels of intensity of the more or less rare movement of the soil;
Cap. 3 Seismic Analysis
33
- a better understanding of the change in the nature of the structural response to the increase of the level of the earthquake; - the evaluation of the dynamic capacity of the whole structure; - the opportunity to compare the behavior of the structure subject
to various earthquakes.
The first step is to define all necessary terms, including the choice of the accelerograms referred to the soil (usually spectrum compatible accelerograms are those used).
Given the accelerogram unscaled a1, which varies as a function of time the terms that
need to be introduced are4:
- The SCALE FACTOR (SF) of a scaled accelerogram, aλ , is the
non-negative scalar λ ∈ [0,+∞) that produces aλ when multiplicatively
applied to the unscaled (natural) acceleration time-history a1.
- A MONOTONIC SCALABLE GROUND MOTION INTENSITY
MEASURE (or simply intensity measure, IM) of a scaled
accelerogram, aλ , is a non-negative scalar IM ∈ [0,+∞) that
constitutes a function, IM = fa1 (λ), that depends on the unscaled
accelerogram, a1, and is monotonically increasing with the scale
factor, λ.
- DAMAGE MEASURE (DM) or STRUCTURAL STATE VARIABLE is a non-negative scalar DM ∈ [0,+∞] that characterizes the additional response of the structural model due to a prescribed seismic loading.
- A SINGLE-RECORD IDA STUDY is a dynamic analysis study of a given structural model parameterized by the scale factor of the given ground motion time history.
The single record IDA study can not fully capture the behavior of the structure.
Cap. 3 Seismic Analysis
34
The IDA can depend on chosen accelerogram, then search for more accelerograms to better represent the response of the structure is sufficient.
- A MULTI-RECORD IDA STUDY is a collection of single-record IDA studies of the same structural model, under different accelerograms.
- An IDA CURVE SET is a collection of IDA curves of the same structural model under different accelerograms, that are all parameterized on the same IMs and DM.
Defining the validity of DM obtained by scaling the used accelerograms is very important.
The value of DM is obtainable by the average of the DM obtained by the earthquakes which have been scaled with the same level of IM. There is the need to figure out if this method of action is correct: the answer depends on the kind of structure, on IM and on DM. It is correct for short periods (1 second), for DM as maximum displacement interstory, with IM as the first way of the period of the acceleration spectral and for a general class of earthquakes (moderate or large magnitude) except where IM is defined by the PGA (Peak Ground Acceleration)5.
About the number of accelerograms to be used, the authors propose a number ranging between 10 and 20 for mid-rise buildings, as the results relating to the seismic demand were sufficiently precise during the tests.
IDA behavior can greatly change depending on several factors: - numerical convergence
- algorithm choice - interpolation problem - DM and IM summarization
5 Peak ground acceleration (PGA) is equal to the maximum ground acceleration that occurred during earthquake shaking at a location. PGA is equal to the amplitude of the largest absolute acceleration recorded on an accelerogram at a site during a particular earthquake.
Cap. 3 Seismic Analysis
35
- sensitivity in the size of earthquakes
IDA offers the possibility to handle a large amount of data for numerous analyzes giving helpful conclusions. The recorded earthquakes, the number of tests for each earthquake, the interpolation results, the approximations are some of the issues that make a difference on the accuracy of the final results. The method is designed to foster a compromise between speed and accuracy.
3.3.1.2
IDA curves properties
IDA curves can be realized in two or more dimensions depending on the number of IM chosen.
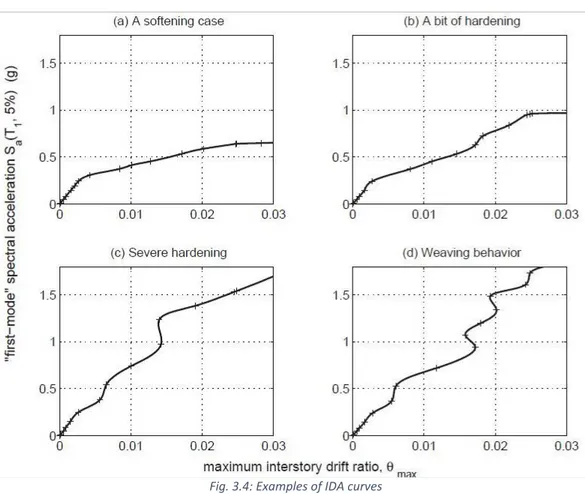
Conventionally, the IM variable is shown on the x-axis and the variable DM is reported on the y-axis. Some examples of these curves are shown in Fig. 3.4 in which are shown 4 different structural behaviors of a framed steel structure of 5 floors.
The response is very variable, although common features are detected, including the initial portion, characterized by a Sa ≤0.2g, almost identical, which ends with the entry
into the plastic range of the first element. The slope IM/DM of this section takes the name of "elastic stiffness" and it is an intrinsic characteristic of the structure.
The four different curves end for different values of IM. In the curve "a", after reaching the condition of first yielding, it leads to a significant degradation of the structure with increasing displacement for small variations of IM. The curves "a", "b", "d" end with a plateau which indicates the attainment of the condition of dynamic instability (defined in analogy to the static instability) and the possible collapse of the structure.
Cap. 3 Seismic Analysis
36
Fig. 3.4: Examples of IDA curves
The behavior of the curves "c" and "d" shows a non monotonic of the measure of damage, parts in which despite the stress increases, DM is reduced. This phenomenon is produced by the occurrence of high losses induced by plastic deformation of some structural elements.
In other words, a strong initial seismic shake produces the yielding of the structural elements present in a plane can happen, which acts as a dissipator, cutting off part of the energy induced by seismic and preserving the other floors from the remaining part of the earthquake.
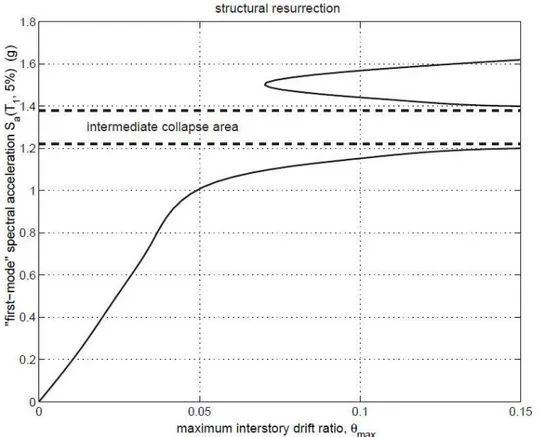
An extreme example of hardening is also represented by the phenomenon of "structural resurrection" (Fig. 3.5). In fact it can happen that the response exhibits a collapse (normally represented by the non-convergence of the numerical DM) for a given IM, while for higher values is found a high damage, but finite.
Cap. 3 Seismic Analysis
37
Fig. 3.5: Example of the phenomenon of structural resurrection
3.3.2 Achievement of performance levels
according to FEMA
Performance levels or limit states are the important "ingredients" in the Performance Based Earthquake Engineering (PBEE), and the IDA curves contain the necessary information to determine them.
FEMA (Federal Emergency Management Agency) put special attention to the different levels (that representing indications, valueless prescriptive) developed in order to provide efficient tools in the rehabilitation of buildings damaged by earthquakes to the designers, in order to determine the damage of structural elements.
Cap. 3 Seismic Analysis
38
The project was carried out through the collaboration of various agencies, such as the Building Seismic Safety Council (BSSC) and the American Society of Civil Engineering (ASCE) and it is characterized for its innovative approach to "performance-based", ie it is focuses on usability and on the damage of the structures rather than on the strength of the elements.
To understand the analysis, briefly describe the fundamental concepts introduced by FEMA is required.
First, four levels of building performance are defined: 1. Operational Level (OL);
2. Immediate Occupancy level (IO); 3. Life Safety Level (LS);
4. Collapse Prevention Level (CP).
These levels represent the discrete points on the ideal continue line describing the behavior of the structure, which then are easily identifiable in the IDA curves. Each level of response of the building is defined according to a performance level of the structure and of a level of performance of the non-structural components.
The association of a level of performance for the building and a certain intensity of seismic activity is a "rehabilitation goal".
Any combination can be considered by the designer, but the one described in the indications of FEMA is the Basic Safety Objective (BSO).
The latter is based on the following assumptions:
- the building has to satisfy the Life Safety Building Performance level for an earthquake of type BSE-1;
- the building has to satisfy the Collapse Prevention Building Performance level for an earthquake of type BSE-2.
IDA curves are an excellent tool to determine the properties of strength and ductility of the structure, and they make it easy to highlight the achievement of