Alma Mater Studiorum – Università di Bologna
DOTTORATO DI RICERCA IN
Scienze della Terra, della Vita e dell’AmbienteCiclo XXIX
Settore Concorsuale di afferenza: 05/B1 Settore Scientifico disciplinare: BIO/08
GENETIC EPIDEMIOLOGY
OF TASTE PERCEPTION AND CIGARETTE USE
Presentata da: Davide Risso
Coordinatore Dottorato Relatore
Prof.ssa Barbara Mantovani Prof.ssa Donata Luiselli
2
1. Introduction……….……4
1.1 Adult Tobacco Use among Ethnic Groups living in the United States …….4
1.1.1 The health consequences of smoking……….………4
1.1.2 Patterns of cigarette smoking………7
1.1.3 Cigarette flavorings……….9
1.2 Human taste genetics………..12
1.2.1 Our sense of taste………...12
1.2.2 Molecular mechanisms of taste………..14
1.2.3 PTC/PROP genetics……….………..16
1.2.4 Genetics of menthol perception……….……….18
2. Abstract………..………..………..…..19
3. Materials and Methods……….20
3.1 Research Participants and collection of phenotypes………...…….20
3.1.1 Schroeder population………..20
3.1.2 Dallas Heart Study……….………21
3.1.3 Dallas Biobank……….………21
3.1.4 Georgia population………..……….22
3.2 Genes selection……….………..22
3.3 Molecular biology………………..23
3.3.1 DNA collection, purification and quantification……….…………..23
3.3.2 DNA sequencing………..24
3.4 Statistical analyses………...28
3
3.4.2 Haplotypes inference………29
3.4.3 Measurements of admixture proportions……….29
3.4.4 Genotype-Phenotype association analyses………..30
3.4.5 Meta-analysis………..…….…30
4. Results………..………31
4.1 Smoking behaviors in the Georgia, DHS and Biobank cohorts……….31
4.2 Menthol cigarette preference among African-Americans and European-Americans….33 4.3 Polymorphic variations at the TRPM8, TRPA1 and TAS2R38 loci……….34
4.4 Admixture levels among African-American smokers……….36
4.5 Associations between TAS2R38 haplotypes, PTC tasting-status and smoking………38
4.6 Meta-analysis of the association between TAS2R38 variants and menthol cigarette preference………..……41
4.7 Associations between TRPM8, TRPA1 variants and menthol cigarette smoking………..42
5. Discussion and Conclusion………...43
6. Appendix……….………48
6.1 Supplementary tables………..………….………48
6.1.1 Appendix Table 1………..……..48
6.1.2 Appendix Table 2………...….49
6.1.3 Appendix Table 3………50
6.2 Most relevant publications during the Ph.D. course………..51
7. References………..……….133
4
1. Introduction
1.1 Adult Tobacco Use among Ethnic Groups living in the United States
1.1.1 The health consequences of smoking
Cigarette smoking is the leading cause of preventable disease and death in the United States, resulting in more than 480,000 premature deaths every year, or one every five deaths (US Department of Health and Human Services, 2014). In addition, more than 16 million Americans live with a smoking-related disease (U.S. Department of Health and Human Services, 2014). Since the first report published in 1964 (Luther L. Terry, 1964) showing a correlation between smoking and lung cancer, thousands of scientific articles have been published documenting the diverse and serious health consequences linked to smoking (Figure 1).
5
Smoking is in fact a risk factor for autoimmune diseases, since it compromises the immune system, making smokers more likely to have respiratory infections. Moreover, smokers are on average 30% to 40% more likely to develop type 2 diabetes when compared to non-smokers. Together with other factors, such as weight, activity level and alcohol consumption, smoking also increases the risk for osteoporosis, which is a major cause of hip fractures that have a major impact on health and longevity in the elderly (www.BeTobaccoFree.gov).
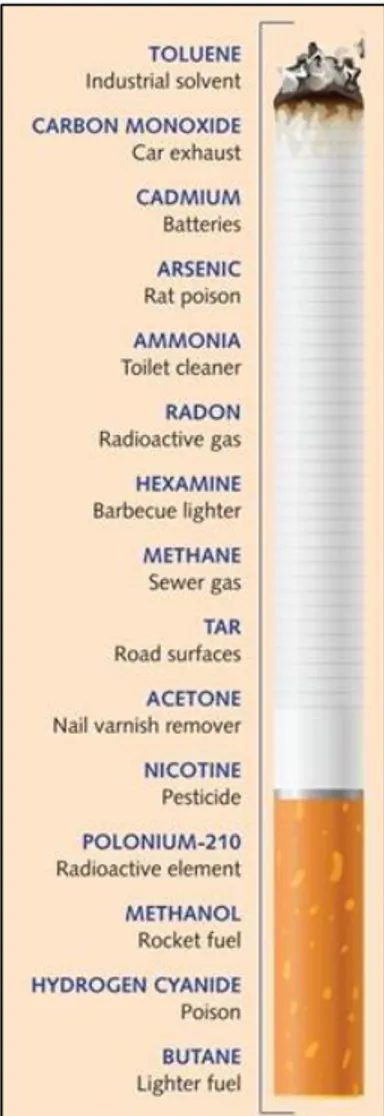
Understanding the composition of cigarettes facilitates the understanding of the correlation between smoking and its many related diseases. There are about six hundred ingredients in cigarettes which, when burned, produce more than 7,000 chemicals. Of these, at least 69 are known to have carcinogenic properties and more than 400 are known to be toxic (American Lung Association, 2010). Smoking cigarettes is the number-one risk factor for lung cancer, and it substantially raises the risk of cancer in other tissues such as trachea, bronchus, esophagus, lips, nasal cavities, bladder, liver, colon and rectum. Some of the most common chemicals found in tobacco smoke are shown in Figure 2. Surprisingly, most of these compounds are also found elsewhere. Acetone, for example, is found in nail polish removers. Acetic acid is an ingredient in hair dyes, while ammonia is a common household cleaner. Arsenic is used in rat poison and benzene is found in rubber cement. Radon and polonium-210 are both radioactive elements. However, the most dangerous compound found in cigarettes is perhaps nicotine, a neuro-active alkaloid that is highly addictive. In small doses, it acts as a brain stimulant however, in large doses, it acts as a depressant, inhibiting the flow of signals between nerve cells (Pomerleau and Rosecrans, 1989).
These chemicals, together with the other ~7000 produced when smoking, damage blood cells, impair heart function, and increase the risks for atherosclerosis, aneurysms and several cardiovascular diseases (including coronary heart diseases, heart attacks, strokes and high blood pressure). In addition, cigarette smoking damages breathing and produces scarring in the lungs, causing diseases such as pneumonia, asthma and increased risk of tuberculosis.
6
Lastly, secondhand smoke (the combination of smoke from the burning end of a cigarette and the smoke exhaled by smokers) causes numerous health problems in non-smokers and is especially harmful to young children (U.S. Department of Health and Human Service, 2006). Second hand smoke is responsible for between 150,000 and 300,000 lower respiratory tract infections in infants and children under 18 months of age, resulting in between 7,500 and 15,000 hospitalizations each year, and is estimated to cause 430 sudden infant death syndrome (SIDS) cases in the United States annually. It may also aggravate symptoms in 400,000 to 1,000,000 children with asthma and cause buildup of fluid in the middle ear, resulting in 790,000 physician office visits per year (California Environmental Protection Agency, 2005)
Figure 2. Some of the most common ingredients found in cigarettes (modified from
7 1.1.2 Patterns of cigarette smoking
Despite significant declines during the past 30 years, millions of adults in the Unites States smoke cigarettes (Agaku et al. 2014). Nearly 17 of every 100 U.S. adults (17%) currently smoke, which translates into 40 million adults in the United States who smoke cigarettes. There has been a steady decline from the smoking rate of 42% of adults in the U.S. in 1965, to 20.9% in 2005. Among U.S. adults, men are more likely to be current smokers than women: nearly 19% of adult men smoke, compared to 5% of adult women. Cigarette smoking is also higher among younger age groups compared to those aged 65 years and older. Nearly 17% of adults aged 18–24 years smoke, 20% of adults aged 25–44 years smoke, and 18% of adults aged 45–64 years smoke, however only 8.5% of adults aged 65 years and older smoke. Different patterns of cigarette smoking are also observed among different ethnicities. As shown in Figure 3, current cigarette smoking is highest among American Indian and Alaska Natives. On average, 32.35% of American Indians and Alaskan Natives are reported to smoke cigarettes. A recent study also found that American Indian and Alaska Natives have a higher percentage of smoking-related deaths from heart disease and stroke, when compared to European-American men and women (Mowery et al. 2015). One possibility that could explain this notable difference in cigarette use is that tobacco products sold on American Indian and Native Alaskan lands are not subject to state and local taxes. For this reason, cigarettes and some other tobacco products are available to American Indians and Alaska Natives at much lower prices compared to other Americans. In addition, several American tribes consider tobacco a sacred gift and use it as a traditional medicine and during religious ceremonies (Reading, 1998).
Lowest rates of cigarette smoking are currently found among Asian and Pacific Islanders, in which groups an average of 10.15% are smokers. Other ethnicities, such as African-Americans, European-Americans and Hispanics showed similar percentages of smokers (21.75%, 22.1% and 15.7% respectively) (American Lung Association, 2010). However, on average, European-American men tend to consume more (~30-40%) cigarettes per year than African-American men (Centers for Disease Control and Prevention, 2008). In addition,
European-8
Americans are less likely to develop lung cancers compared to African-Americans. These differences could be due to either environmental (such as disparities in access to healthcare and socio-economic status) or genetic factors. Other differences in cigarette smoking, are associated with differences such as in education. Current cigarette smoking rates are higher among people with no higher education or diploma, and lowest among those with a graduate degree. Nearly 23% of adults with 12 or fewer years of education (e.g. no higher education) are smokers, while only 5.4% of individuals with a graduate degree smoke. Cigarette smoking also varies by income status and U.S. Census Region. 26.3% of people living below the poverty level are smokers, compared to 15.2% of adults who live at or above the poverty level. Smokers are also more concentrated in the Midwest (20.7%), rather than in the West (13.1%) or in the East (16.8%) (Centers for Disease Control and Prevention, 2014).
Figure 3. Smoking prevalence by different ethnicity (Modified from American Lung Association, 2010).
9 1.1.3 Cigarette flavorings
On June 22nd, 2009, the Family Smoking Prevention and Tobacco Control Act
gave the Food and Drug Administration (FDA) authority to regulate the manufacture, distribution and marketing of tobacco products (www.fda.gov). The result of this Act was to ban the use of all flavors other than menthol in cigarettes. However, there are currently no restrictions in terms of banning flavors in other tobacco products (such as little cigars and smokeless tobacco) (H.R. 1256—11th Congress, 2012).
Menthol is an organic compound that could be created synthetically or extracted from plants. Perhaps the most widely recognized property of menthol is its cooling effect on the mouth and throat, which arises from the fact that menthol acts as a chemical agonist of receptors that normally act to sense cold temperatures (Bautista et al. 2007). This cooling effect is especially important in terms of smoking as it reduces the harshness of cigarette smoke (Verger and McCandless, 2011). Because of this, the tobacco industry started to add menthol to cigarettes in the 1920s and 1930s, but it wasn’t until the 1950s and 1960s that the practice became widespread (Tobacco Products Scientific Advisory Committee, 2011). Today menthol cigarettes represent a significant part of the U.S. cigarette market, making up to 32.0% of all cigarettes sold (Federal Trade Commission, 2013). About 20 million people in the U.S. smoke menthol cigarettes (Substance Abuse and Mental Health Services Administration, 2011). Menthol cigarette use varies greatly depending on different factors. For example, data have shown that menthol cigarette use is higher in youth than in either young adults or adults. 56.7% of young smokers are reported to smoke menthol cigarettes, compared to 35.2% of adult smokers (Giovino et al. 2013). Several studies have shown that menthol flavoring contributes to addiction in young smokers (Sutton and Robison, 2004; Tobacco Products Scientific Advisory Committee, 2011) and that young smokers are significantly more likely to be addicted to nicotine than non-menthol cigarette smokers (Hersey et al. 2006; Nonnemaker et al. 2013). Moreover, it has been shown that adult menthol smokers are less likely to successfully quit smoking, when compared to non-menthol cigarettes smokers (Cubbin et al. 2010; Hyland et al. 2002; Fu et al.
10
2008), suggesting that menthol cigarettes are harder to quit for everyone, regardless of age.
A remarkable difference in menthol cigarette exists among different ethnic groups. Among African-Americans who smoke, an average of 84.5% are reported to use menthol cigarettes, compared to only 26.9% of European-Americans and 33.6% and of Asian-American smokers. (Substance Abuse and Mental Health Services Administration, 2011; American Lung Association, 2010). African-American smokers are nearly 11 times more likely to use menthol cigarettes than European-American smokers. This is of importance, since there are several lines of evidence that cigarette manufacturers have specifically targeted African Americans with menthol cigarette advertising (U.S. Department of Health and Human Services, 1998; Gardiner, 2004). For this reason, around 20% of Americans believe that menthol should be banned from cigarettes (Pearson et al. 2012). Studies have shown that if menthol cigarettes were banned, around 40% of all smokers would try to quit smoking, with higher percentages (64.6%) among youth adult menthol cigarette smokers (Pearson et al. 2012). This makes studying the causes of menthol cigarette preference among smokers of great public health importance, as it is estimated that around 320,000 smoking-attributable deaths could be avoided by 2050 if a menthol ban went into effect (Levy et al. 2011).
These data are confirmed and strengthen by two recent independent reports. The first was issued by the Tobacco Products Scientific Committee (TPSAC) (2011) and the second by the Food and Drug Administration (FDA) (2013). Both these reports highlighted how menthol increases experimentation and progression to regular smoking and makes it harder for smokers (especially African-American smokers) to quit. In addition, a survey of menthol and non-menthol cigarette consumption in the USA (Delnevo et al. 2014) showed that the decline in cigarette consumption was greater among non-menthol cigarettes, compared to menthol cigarettes (37% vs. 20%) (Figure 4). An explanation that was proposed involved higher rates of initiation for menthol compared to non-menthol cigarettes, lower cessation among non-menthol smokers, increased consumption among current menthol smokers, and switching from non-menthol to menthol cigarettes.
11
Finally, it has been suggested that taste preference may play a role in cigarette smoking and/or the addiction of flavoring agents to cigarettes. This is because nicotine generally tastes unpleasantly bitter and evokes irritant sensations (Oliveira-Maia et al. 2009) that are masked and reduced by the addition of menthol to cigarettes, which elicits cooling and fresh effects.
Figure 4. Menthol and non-menthol cigarette consumption in the USA, 2000– 2011 (from Delnevo et al. 2014).
12
1.2 Human taste genetics
1.2.1 Our sense of taste
The sense of taste helps organisms to identify, choose and consume desirable nutrients, while avoiding harmful and potentially toxic compounds. So far, five tastes (e.g. bitter, sweet, umami, salty and sour) have been universally recognized in humans, while a sixth taste (i.e. fat) is not agreed upon by all scientists as a distinct taste perception quality (Besnard et al. 2016). Each taste has evolved in response to specific environmental stimuli. Bitter taste, for example, is believed to have evolved to prevent the ingestion of an enormous array of potentially toxic compounds, since such compounds typically taste bitter and usually evoke innate aversive behavior in different animal species. Many of these compounds are contained in plants and are produced by micro-organisms, and may generate different bitter reactions in species-specific bitter taste receptors (Bachmanov et al. 2014). On the other hand, sweet and umami taste have evolved to recognize a limited subset of nutrients. Sweet taste is universally appreciated by humans and signals the presence of carbohydrates that serve as an energy source. Although umami is lesser known than sweet taste, it has been equally important during the course of our evolution. It’s the taste of L-glutamate and other L-amino acids (including aspartate and phenylalanine) which reflect a food’s protein content. Salty taste is essential for maintaining body’s water balance and blood circulation, governs the intake of Na+ and other salts and the proper dietary electrolyte balance. Lastly, sour taste signals the presence of dietary acids and is generally aversive. This mechanism allows us to avoid ingesting excess acids and unbalancing the acid-base balance of the body (Bachmanov et al. 2014).
Taste-receptor cells (TRCs) represent the anatomical substrates and units of taste detection. 50 to 150 of these cells are assembled into taste buds, which are distributed across different papillae of the tongue and palate epithelium (Chandrashekar et al. 2006). Humans have three major kinds of papillae, located on different parts of the tongue. Circumvallate papillae are located at the very back of the tongue and contain thousands of taste buds. Foliate papillae are located at the posterior lateral edge of the tongue and contain a lower amount
13
(dozens to hundreds) of taste buds. Finally, fungiform papillae have one or a few taste buds and are found in the anterior two-thirds of the tongue (Chandrashekar et al. 2006) (Figure 5).
Figure 5. Location of human taste papillae on the tongue (Adapted from Chandrashekar et al. 2006).
The interaction between taste buds and ligands/tastants occurs through taste pores, created when taste-receptor cells converge to create a pore and project microvilli to the apical surface of the taste bud. Interaction of tastants on the surface of taste cells results in an excitation that is transmitted via afferent gustatory nerves to the brain, where it evokes taste perception which has several characteristics, including with intensity, quality and hedonics (Bachmanov et al. 2014).
14 1.2.2 Molecular mechanisms of taste
Taste sensitivity to bitter, sweet and umami is mediated by seven-trans-membrane domain (7TM) G-protein coupled receptors (GPCRs). GPCRs are a large protein family of receptors that sense molecules outside the cell and activate signal transduction pathways and responses inside the cell. These components are expressed in taste cells within taste buds on the tongue (Gilbertson et al. 2000; Smith and Margolskee, 2001) and in other extra-oral tissues such as gut, lungs and testis (Finger and Kinnamon 2011), where they modulate systemic functions of tastants either endogenously produced or contained in foods (Clark et al. 2015; Shaik et al. 2016). The bitter taste receptor family is designated as TAS2R (formerly T2R) and is composed of 25 functional human bitter taste receptors coded by TAS2R genes (Chandrashekar et al. 2000; Bufe et al. 2002). In addition, humans have 11 TAS2R pseudogenes (Go et al. 2005). The sweet and umami taste receptor family is much smaller, encoded by only three receptor genes. The genes encoding for these receptors are named
TAS1R1, TAS1R2 and TAS1R3 (formerly designated T1R’s) whose products form
heterodimers that serve as either sweet (TAS1R2+TAS1R3) or umami (TAS1R1+TAS1R3) receptors (Li et al. 2002). When either TAS2R or TAS1R receptors bind to taste molecules, they activate heterotrimeric GTP-binding proteins. This frees different G subunits (G α-gustducin and Gγ 13, for example) which functionally interact with phospholipase-C-beta-2 (PLCβ2), a phospholipase that stimulates the synthesis of inositol phosphate three (IP3) as a second messenger. This opens different ion channels on the endoplasmic reticulum which ultimately release Ca2+ into the cytosol of the receptor cells. The elevated intracellular Ca2+ acts to open two different ion channels found in receptor cells: TRPM5 and a gap junction hemichannel causing a strong depolarization that permits the secretion of ATP and other taste bud transmitters into the extracellular space (Chaudhari and Roper, 2010). This leads to the transmission of neural impulses to the brain via the chorda tympani and glossopharyngeal nerves (Hellekant et al. 1997).
The molecular mechanisms of sour and salty tastes, as well as the genes encoding their receptors, are less well understood. Some lines of evidence have shown that
15
salt perception may be mediated by one or multiple ion channels. The ions of salt, especially sodium (Na+), can pass directly through ion channels in the tongue, leading to an action potential. One receptor that is thought to be involved in salty taste perception is the amiloride-sensitive epithelial Na channel, ENaC (Stähler et al. 2008). It is thought that an acid sensor, such one or several hydrogen ion channels, could mediate sour taste. However, despite many attempts has been made to identify the sour taste receptor, the molecular mechanisms that underlie sour perception are still uncertain (Kim et al. 2004).
16 1.2.3 PTC/PROP genetics
The simplest and best understood taste variation in humans is the ability to taste phenylthiocarbamide and 6-n-propylthiouracil. These compounds, otherwise known as PTC and PROP respectively, are well-known because of their ability to generate a bitter taste in some individuals but not in others. This chance discovery was made more than 70 years ago, by the chemist Arthur Fox who was pouring some powdered PTC into a bottle. Noticing that only some people started complaining about a bitter taste in the air, Fox asked different people to taste this chemical and report how it tasted. In this way, he discovered that some people could not perceive any taste at all (“non-tasters”), while others could recognize a strong bitter taste (“tasters”) (Fox, 1932). Since then numerous family, twin and population studies have shown that the inability to taste PTC is inherited in a nearly Mendelian recessive manner (Blakeslee, 1932; Drayna et al. 2003; Knaapila et al. 2012). In 2003, a locus that explained approximately 75% of the variation in PTC sensitivity was identified on chromosome 7 (Drayna et al. 2003). At this locus, variation in the TAS2R38 bitter receptor gene was subsequently found to underlie all the bimodal distribution of this phenotype and to explain >70% of the total phenotypic variance (Kim et al. 2003). A subsequent study replicated this finding and confirmed that this genetic variation also underlies the differential sensitivity to PROP (Bufe et al. 2005).
TAS2R38 is a member of the TAS2R bitter taste receptor gene family, which in
humans consists of 25 functional genes and 11 pseudogenes, many of which show signatures of natural selection (Campbell et al. 2012, Risso et al. 2014, Risso et al. 2016). Like many other genes encoding GPCRs, TAS2R38 has only a single coding exon of 1002 bp in length. Within this coding sequence, three single nucleotide polymorphisms (rs714598, rs1726866, rs10246939) at positions encoding amino acids 49, 262 and 296 represent the most common variant alleles of TAS2R38, and comprise the “taster” PAV (Proline, Alanine, Valine) and “non-taster” AVI (Alanine, Valine, Isoleucine) haplotypes. In addition, two uncommon (frequency < 5%) (AAV and AAI) and four rare (frequency < 1%) haplotypes (PAI, PVI, AVV and PVV) carrying different combinations of these three variant amino acids have been identified. Analysis of the population
17
genetics of TAS2R38, showed that approximately ~40% of worldwide individuals were AVI-carriers (Wooding et al. 2004; Risso et al. 2015). This represented a paradox since it is thought that bitter taste has evolved to prevent ingestion of potentially toxic or harmful compounds found in plants. How a presumably non-functional allele rose to such a high frequency in the population was not clear. Two major explanations have been presented to explain the unexpectedly high frequency of the non-taster AVI haplotype. Authors of several papers (Fisher et al. 1939; Wooding et al. 2004; Campbell et al. 2012) have hypothesized that both the taster and non-tasters form were maintained by balancing natural selection, suggesting that the AVI receptor could encode a functional receptor for some other toxic bitter compounds present in nature and not yet identified (Drayna, 2005). Another explanation is that genetic drift could explain the present-day distribution of TAS2R38 forms, which reached their present population frequencies and distribution due to random fluctuations and could be due to demographic events, rather than selective ones (Wang et al. 2004; Risso et al. 2016).
TAS2R38 haplotypes have been hypothesized to influence smoking habits and
nicotine dependence, since it has been shown that this gene has a lower expression in smokers, when compared to non-smoker individuals (Aoki et al. 2014). However, the results of previous studies have been conflicting. For example, a study examining both African-American and European-American individuals found a significant association between TAS2R38 haplotypes and smoking, with the non-taster AVI haplotype being positively associated with smoking quantity and nicotine dependence, however this was seen only in African Americans (Mangold et al. 2008). Another study analyzed German participants and found that individuals carrying the PAV taster haplotype smoked significantly fewer cigarettes per day (Keller et al. 2008). In contrast, another study of individuals of European descent found no association between the PAV or AVI haplotypes and smoking (Cannon et al. 2005). However, this study found that the rare AAV haplotype was associated with a lower incidence of smoking.
18 1.2.4 Genetics of menthol perception
Another gene family codes for a different kind of temperature and ligand receptors. The products of this transient-receptor-potential (TRP) channel family can detect a wide range of changes in ambient temperature, from extremely cold to painfully hot (Jordt et al. 2003). In addition, different genes of this family encode receptors for ligands that can elicit specific psychophysical sensations, such as the cold sensation generated by menthol. In this regard, it has been shown that the eight members of the TRP M-subfamily, namely TRPM8, is activated by menthol and other chemical cooling agents when temperatures drop below ~26 °C, suggesting that the menthol receptor is also the principal detector of environmental cold (Bautista et al. 2007). This gene is located on chromosome 2 and is composed by 27 exons, spanning a total genomic distance of 102,161 base pairs. Because menthol, eucalyptus oil and other similar cooling agents act as chemical agonists of a receptor that normally senses environmental cold, they provide a sensation that food containing these compound is cold. Moreover, menthol also binds to a kappa opioid receptor (Galeotti et al. 2002), which produces a numbing effect and decreases the effects of inflammation. Interestingly, it has been discovered that TRPA1, another member of the TRP family, is also involved in pain and cold perception (del Camino et al. 2010). This gene is located on chromosome 8 and composed of 27 exons with a total size of 70,093 base pairs. Moreover, studies carried out in mice demonstrated that the protein encoded by this gene is a highly sensitive menthol receptor (Karashima et al. 2007). Analysis of human phenotypes and genotypes confirmed this initial hypothesis with a focus on menthol cigarette smoking. For example, a recent study showed that TRPA1 haplotypes are highly associated with menthol preference in European-American smokers (Uhl et al. 2011).
In addition, polymorphisms in the TAS2R38 bitter taste receptor gene have been recently associated with menthol cigarette smoking. A study examining 323 European-American pregnant smokers identified an association between the taster haplotype (i.e. PAV) of this gene and a preference for menthol cigarettes (54% vs. 30%, P<0.001) (Oncken et al. 2015).
19
2. Abstract
Tobacco use is a major worldwide health problem and is a leading cause of preventable disease. Cigarettes and other tobacco products contain bitter compounds including nicotine, which contribute to the chemosensory properties of tobacco and stimulate multiple sensory systems, including taste transduction pathways. Since bitter taste has evolved to identify potentially toxic compounds, and thus protect against harmful foods, our hypothesis is that aversion to this taste may prevent smoking and nicotine dependence.
The goal of this research was to investigate the role of inherited differences in taste perception in smoking behaviors. We sought to determine whether such genetic variation could account for the well-known differences in flavored tobacco use among different U.S. ethnic groups. For example, around 80% of African-American smokers report that they prefer menthol cigarettes, compared to only 30% of European-American smokers who express this preference. We recruited subjects from four different populations, comprising a total of 9871 individuals (8191 African-Americans and 1590 European-Americans), purified DNA’s from some saliva or blood samples and used a candidate gene (e.g. Sanger sequencing) approach to sequence taste-related genes.
We identified several genetic associations between polymorphisms in taste-related genes and different smoking behaviors. We have shown that the frequency of the TAS2R38 taster haplotype differs between smokers and non-smokers in European-American populations (37.0% vs. 44.0% in non-smokers, P=0.003). In addition, we identified two SNPs, one located in the menthol receptor TRPM8 and one in the menthol-reactive gene TRPA1, that are strongly associated with menthol smoking in a study group of African-Americans (OR=6.1, P=3.12E-09, OR=2.52 OR=0.5, P=1.51E-03 and OR=0.5 and P=1.22E-05). Moreover, we found that the taster haplotype (i.e. PAV) of the TAS2R38 bitter taste receptor gene is less common in European-American smokers (37.0% vs. 44.0% in non-smokers, P=0.003) and that the non-taster haplotype of this gene (i.e. AVI) is significantly lower in menthol smokers compared to non-menthol smokers (29.8% vs. 37.7%, P=0.008).
Overall, these findings support the hypothesis that variations in taste-related genes play a role in the choice of cigarettes when smoking. Understanding genetic differences in taste perception in tobacco use could help inform the development of more effective tobacco control policies.
20
3. Materials and Methods
3.1 Research Participants and collection of phenotypes
A total of 9871 individuals (8191 African-Americans and 1590 European-Americans) including both smokers (menthol and non-menthol cigarettes) and non-smokers, were analyzed. They belonged to four different cohorts, as described below. Subjects were enrolled with written informed consent under protocols approved for human subjects research protection at all participating sites.
3.1.1 Schroeder population
A total of 718 Washington DC resident smokers were recruited through the DC Tobacco Quitline (DCQL), a smoking cessation program based at The Schroeder Center in Washington, DC (https://www.tobaccocontrolresearch.org/). All subjects were African-Americans aged > 18 years and a majority (56.5%) were menthol cigarette smokers. Information on general variables, such as gender, cigarettes per day (CPD), marital status and education level was obtained from all subjects. In addition, we collected data from the brief Wisconsin Inventory of Smoking Dependence Motives (WIDSM), a 37-item scale psychometric instrument designed to evaluate the extent of smoking motivation and nicotine dependence (Piper et al. 2008). Scores for each of the 11 subscales of the WISDM scale were calculated by taking the average item scores, and the primary dependence score (PDM) and secondary dependence score (SDM) were computed. Study procedures were approved by the Western IRB and by the National Institutes of Health Combined Neurosciences IRB under protocol 01-DC-0230.
21 3.1.2 Dallas Heart Study (DHS)
The Dallas Heart Study is a multiethnic population-based probability sample of Dallas County, Texas residents (Victor et al. 2004). The original cohort (DHS-1) was enrolled between 2000 and 2002 and all participants, as well as their spouses or significant others, were invited for a repeat evaluation in 2007–2009 (DHS-2). During each visit, participants completed a detailed survey including questions regarding demographics, socioeconomic status, medical history, and lifestyle factors (including tobacco use), and underwent a health examination. Ethnicity was self-assigned. A total of 2,363 African-American and 1,353 European-American DHS participants with available genotype and smoking phenotype data were included in the present study. Current smokers were defined as individuals who smoked at least 100 cigarettes in their lifetime and smoked on at least some days in the previous 30 days. Smoking quantity was defined as a categorical variable in all cohorts, sub-dividing smokers into three groups (less than 6 cigarettes per day, 6–19 cigarettes per day, and 20 or more cigarettes per day). The study was approved by the Institutional Review Board of University of Texas Southwestern Medical Center and all participants provided written informed consent.
3.1.3 Dallas Biobank
The Dallas Biobank is a repository of DNA and plasma samples from individuals ascertained at various locations in north-central Texas. The present study includes a total of 4,973 African American Biobank participants for whom the genotype and smoking phenotype data were available. All participants were over 18 years of age and signed an informed consent that was approved by the University of Texas Southwestern Medical Center IRB. Current smokers were defined as people who identified themselves as smokers and said they were currently using tobacco products.
22 3.1.4 Georgia population
A total of 237 European-Americans was chosen based on their tobacco product usage from a longitudinal study involving young adults attending seven Georgia colleges or universities (Berg et al. 2016). Variables including sex, age and current smoking status were obtained from all participants during a web-based baseline survey in the fall of 2014. Smoking status information was also obtained again in Spring 2015. Individuals were defined as current smokers if they reported to have smoked in the past 30 days. In the spring of 2015, participants were sent a commercial taste-strip containing the bitter compound phenylthiocarbamide (PTC, Thermo Fisher Scientific Inc., Catalog Number: S85287A) via mail with instructions regarding how to complete the taste-strip test. The responses were recorded by participants and returned, and participants were then defined as “tasters” if they categorized the taste of the PTC papers-strip to be “mild or strong” and as non-tasters if they reported “no taste”. Signed informed consent was approved by the Institutional Review Boards of Emory University, ICF Macro International, Albany State University, Berry College, University of North Georgia, and Valdosta State University.
3.2 Genes selection
We selected a total of 27 genes that encode products known to participate in human taste perception, designated taste-related genes, and performed a candidate-gene sequencing approach. In particular, we studied two menthol receptor genes (i.e. TRPM8 and TRPA1) and 25 bitter taste receptor genes (TAS2Rs). Of these 25 TAS2Rs, we particularly focused on one member of this family (i.e. TAS2R38) because of previous data in the literature suggesting possible associations between variations in this gene and different smoking behaviors (Cannon et al. 2005, Mangold et al. 2008, Uhl et al. 2011, Keller et al. 2013, Oncken et al. 2015). We mainly focused our attention on the coding regions of these genes, however for TRPM8 and TRPA1 we additionally selected evolutionary conserved intronic regions to assay most of the variation in these
23
non-coding areas. To identify them these regions, we used the comparative genomics tool of the UCSC Genome Browser (https://genome.ucsc.edu/).
3.3 Molecular biology
3.3.1 DNA collection, purification and quantification
DNA from the Schroeder and Georgia populations was collected using Oragene saliva collection kits and extracted with an ethanol precipitation protocol,
according to the manufacturer’s instructions
(http://www.dnagenotek.com/US/pdf/PD-PR-052.pdf, Genotek Inc., Kanata, Ontario, Canada), as follows:
1. Mix the sample in the DNA Genotek kit by inversion and gentle shaking for a few seconds.
2. Incubate the sample at 50°C in a water incubator for a minimum of 1 hour or in an air incubator for a minimum of 2 hours.
3. Add 20 µL of PT-L2P to each well of the plate.
4. Transfer 5 µL of Blue Dextran (1 mg/mL) to each well of the plate. 5. Transfer 500 µL of sample to each well.
6. Cover plate with adhesive cover sheet or reusable mat. Press into place to seal. Mix manually by inversion 5 times.
7. Incubate at -20°C for 10 minutes.
8. Centrifuge plate at room temperature for 10 minutes at 4,200 x g. 9. During centrifugation, label a second 96-well plate.
10. When centrifuge has stopped, transfer 450 µL of the supernatant from the first plate to the second plate. Take care not to disrupt the pellet.
11. To the new plate containing supernatant add 350 µL of Isopropanol (room temperature) to each well.
12. Cover plate with adhesive cover sheet or reusable mat. Press into place to seal. Mix manually by slowly inverting 10 times. Incubate at room temperature for 10 minutes. 13. Centrifuge plate at room temperature for 10 minutes at 4,200 x g.
14. Carefully remove as much supernatant as possible from each well without disturbing the pellet. Discard the supernatant.
15. Add 400 µL of 70% ethanol (room temperature) to each well.
16. Cover plate with adhesive cover sheet or reusable mat. Press into place to seal. Mix by vigorous vortexing.
17. Centrifuge plate at room temperature for 10 minutes at 4,200 x g.
18. Carefully remove all the supernatant from each well without disturbing the pellet. Discard the supernatant.
19. The plate should be pulsed centrifuged for 20 seconds to collect any leftover ethanol. 20. Using a pipette carefully remove ALL residual ethanol and air-dry the plate for 5
minutes.
21. Add 50-100 µL of TE buffer to each well and cover plate with adhesive cover sheet or reusable mat.
22. Vortex vigorously to ensure any pellet on the side of the well is dislodged and re-hydrated. Place the plate on a shaker or rocker to help fully re-hydrate the DNA pellet overnight.
24
In the DHS and the Dallas Biobank populations, leukocytes were isolated from 40 ml of blood, and 1/3 of the cells were used to extract genomic DNA. Quantification of the DNA’s was obtained through both the Quant-iT dsDNA Broad-Range Assay Kit (Invitrogen, Carlsbad, CA) and with a NanoDrop™ spectrophotometer (Thermo Fisher Scientific Inc.). The former uses an intercalating agent of DNA, PicoGreen, that is an ultra-sensitive fluorescent nucleic acid stain for quantifying in solution double-stranded DNA (dsDNA), which emits a luminous signal proportional to the length of the DNA sequence. The latter measures the level of nucleic acid absorbance at 260 and 280 nm to assess the purity of DNA.
3.3.2 DNA sequencing
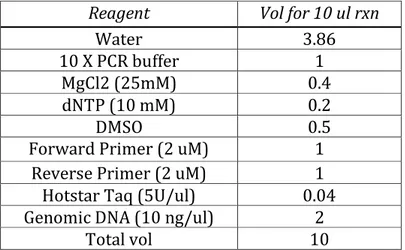
Coding and intronic regions of the selected genes TRPM8, TRPA1 and TAS2R38 were completely sequenced using dideoxy Sanger sequencing (Sanger et al. 1977) in the Schroeder and Georgia populations. A polymerase chain reaction (PCR) was performed to amplify the regions of interest, using the reaction mix shown in Table 1 and the parameters shown in Table 2.
Table 1. PCR mix reagents for TRPM8, TRPA1 and TAS2R38 amplification.
Reagent Vol for 10 ul rxn
Water 3.86
10 X PCR buffer 1
MgCl2 (25mM) 0.4
dNTP (10 mM) 0.2
DMSO 0.5
Forward Primer (2 uM) 1
Reverse Primer (2 uM) 1
Hotstar Taq (5U/ul) 0.04
Genomic DNA (10 ng/ul) 2
25
Table 2. Thermal cycler setting parameters for TRPM8, TRPA1 and TAS2R38 amplification.
Step Time Temp (°C) Cycles
Initial DNA
denaturation 15 min 94 1
DNA denaturation 20 secs 94
35
Primer annealing 30 secs 56
Extension 1 min 72
Final extension 7 min 72 1
A complete list of the primers used to amplify the genomic regions of interest is shown in Appendix Tables 1,2,3. After this first PCR step, a PCR cleanup was performed to remove the excess of PCR primers and dNTPs, using the reaction mix shown in Table 3.
Table 3. PCR mix reagents for TRPM8, TRPA1 and TAS2R38 amplicons clean-up.
Reagent Vol for 10 ul
Water 7.85
SAP buffer (10X) 2
Shrimp Alkaline Phosphatase (1 U/ul) 0.1
Exonuclease I (10 U/ul) 0.05
Total Vol 10.0
Then, forward and reverse sequencing reactions were prepared in separate tubes, using the mixture shown in Table 4, and DNA was sequenced with a BigDye® terminator dye, according to the manufacturer’s protocol (https://tools.thermofisher.com/content/sfs/manuals/MAN0015666_BigDyeTe rminator_V3_1_CycleSeq_QR.pdf, Thermo Fisher Scientific Inc.) and the parameters shown in Table 5.
26
Table 4. Reagent mix used for BigDye reactions to sequence TRPM8, TRPA1 and
TAS2R38 genes.
Reagent Vol for 10 ul
Water 4.3 Sequencing Buffer 2 Primer (2 uM) 1 Dimethyl Sulfoxide 0.5 Master mix 0.2 Template 2 Total Vol 10
Table 5. Thermal cycler setting parameters for TRPM8, TRPA1 and TAS2R38 sequencing.
Step Time Temp (°C) Cycles
Initial DNA denaturation 15 min 96 1
DNA denaturation 10 secs 96 25
Primer annealing 4 min 60
A complete list of the primers used to sequence the amplified genomic regions of interest is shown in Appendix Tables 1,2,3. Products of sequencing reactions were then purified using an ethanol precipitation using the following protocol:
1. Add 2.5 ul of 125 mM EDTA 2. Add 30 ul of 100% EtOH
3. Seal the plate with aluminum foil tape and mix by vortexing 4. Incubate at room temperature for 15 min
5. Centrifuge at 3000 rpm for 30 min
6. Invert the plate over the sink to discard supernatant and spin the inverted plate at 1000 rpm
7. Add 50ul of 70 % ethanol to each well. Do not vortex 8. Centrifuge at 3000 rpm for 15 min
9. Invert the plate over the sink to discard supernatant and spin the inverted plate at 1000 rpm
10. Leave the plate for 10 min to dry it
27
Finally, separation of sequencing reaction purified products based on length and fluorescent label, was performed by capillary electrophoresis on an automatic sequencer ABI 3730 DNA Analyzer (Applied Biosystems, USA).
DNA chromatograms were then analyzed and checked individually to evaluate the presence of calling errors with the Lasergene suite (DNASTAR, Madison,Wisconsin).
In the DHS and the Dallas Biobank populations, participants were previously
genotyped using the Illumina Human-Exome BeadChip
(
http://support.illumina.com/content/dam/illumina-support/documents/documentation/chemistry_documentation/humanomniexp ress-24/infinium_hts_assay_protocol_user_guide_15045738_a.pdf), as described in Victor et al. (2004). This genotyping produced focused coverage of exonic regions and included a total of 243,345 markers. Specific re-sequencing of candidate genes and/or variants of interests was performed in order to replicate the associations found in intronic regions in the other cohorts through Sanger sequencing.
28
3.4 Statistical analyses
Statistical tests focused on different smoking phenotypes. The association between TRPM8, TRPA1 and TAS2R38 gene variants and menthol cigarette smoking was tested in the Schroeder population, while associations between
TAS2R38 gene variants and cigarette smoking was examined in all the studied
cohorts.
3.4.1 Descriptive statistics
R statistical analysis software (R Development Core Team 2011) was used to compare baseline characteristics of the study participants of different cohorts. Continuous variables were compared using t-tests, while categorical variables were compared using chi-square tests. In addition, estimates of some descriptive statistics were calculated using the DnaSP package (Rozas et al. 2003). In particular, we calculated the nucleotide diversity, which is defined as the probability that two randomly chosen homologous nucleotides are different in the sample, along with the average number of nucleotide differences.
As an additional measure of genetic differentiation, we calculated Wright’s FST
index (Wright 1969) with Arlequin v.3.5 (Excoffier et al. 2005) as follows:
Where p and Vp are the mean and the variance of gene frequencies between two (or more) populations, respectively. This fixation index measures the level of population differentiation due to genetic structure and ranges from 0 to 1, where values close to 0 indicate low genetic differentiations, while values approaching one suggest high genetic differentiation.
29 3.4.2 Haplotypes inference
The Bayesian algorithm implemented in the software PHASE v.2.1 (Stephens et al. 2001) was used to statistically infer haplotypes from genotype data, using individuals from the 1000 Genomes Phase III as a reference (1000 Genomes Project Consortium et al. 2015). Only haplotypes with posterior probability of 90% or above were considered for further analyses. In addition, we constructed haplotype networks in order to better infer and represent the evolutionary relationships among populations based on their genetic characteristics. For this purpose, we used the median joining algorithm implemented in the software Network v.4.5 (Bandelt et al. 1999).
3.4.3 Measurements of admixture proportions
To measure the admixture level of the recruited African-American individuals, 48 (24 menthol cigarette smokers and 24 non-menthol cigarette smokers) randomly chosen African-Americans from the Schroeder population were
genotyped with the Illumina HumanOmni1 Chip
(http://www.illumina.com/documents/products/datasheets/datasheet_human omni1_quad.pdf) which allows, on average, the assay of 1.140.419 markers, several of which are ancestry-informative. In addition, admixture levels of African-Americans from the Dallas Heart Study population (genotyped with the Illumina Human-Exome BeadChip) were also calculated. For this purpose, we used the Admixture v.1.3 software (Alexander et al. 2009) after filtering the SNPs for deviations from Hardy-Weinberg equilibrium (P>0.000001), missingness (P<0.05) and removing SNPs in high Linkage Disequilibrium (R2>0.7). We then
performed a principal component analysis (PCA) using PLINK 1.9 software (Chang et al. 2015) using populations of the 1000 Genomes population project (1000 Genomes Project Consortium et al. 2015) and of the Human Genome Diversity Project (HGDP) (Pickrell et al. 2009) as reference populations.
30 3.4.4 Genotype-Phenotype association analyses
PLINK 1.9 (https://www.cog-genomics.org/plink2, Chang et al. 2015) was used to perform an initial quality control of genotypes. This excluded variant with a call rate <90% or a deviation from Hardy-Weinberg equilibrium (HWE) (P<0.001). PLINK was also used to calculate measures of alleles frequencies in the examined populations and to compare minor allele frequencies (MAF) between different smoking phenotypes through the calculation of chi-square tests and resultant p-values. Since multiple statistical tests were performed, we adjusted the p-values for each SNP to reduce the possibility of false positives. We therefore applied the Bonferroni multiple testing correction, multiplying the p-values by the number of total SNPs tested, with the following formula:
Corrected p-value = p-value X number of tested SNPs
After this correction, we considered a corrected p-value < 0.05 as significant. The resultant corrected p-values were additionally adjusted for demographic variables such as age and sex to further reduce the possibility of false positives.
3.4.5 Meta-analysis
In order to compare our associations with previous findings, we performed a meta-analysis using PLINK 1.9 (https://www.cog-genomics.org/plink2, Chang et al. 2015) using a random effects model, to calculate p-values (P), odds ratios (OR) and 95% confidence intervals. The results were then shown in a forest plot, generated with R software (R Development Core Team 2011).
31
4. Results
4.1 Smoking behaviors in the Georgia, DHS and Biobank cohorts
Differences in smoking behavior patterns were analyzed in the Georgia, DHS and Biobank populations. Baseline and demographic characteristics of these study populations, stratified by cohort, are shown in Table 6.
Table 6. Characteristics of the study participants in the three different cohorts. DHS, Dallas Heart Study; AA, African-Americans; EA, European-Americans.
Characteristic Georgia-EA DHS-AA DHS-EA Biobank-AA
Number of participants 237 2363 1353 4973 Age, mean (SD) 20.9 (1.9) 48.2 (11.3) 50.1 (11.2) 44.8 (14.6) Female, N (%) 121 (51.0%)` 1410 (59.7%) 724 (53.5%) 3238 (65.1%) Smokers, N (%) 123 (51.9%) 723 (30.6%) 316 (23.4%) 1526 (30.7%) Smoking quantity*, N (%) <=5 cigs/day 91 (74.0) 211 (29.5) 47 (15) 715 (53.7) 6-19 cigs/day 28 (22.7) 318 (44.5) 116 (37.1) 554 (41.6) >=20cigs/day 4 (3.3) 186 (26) 150 (47.9) 63 (4.7) n/r / 8 3 194
*Smoking quantity was not available for some participants. n/r = non-response.
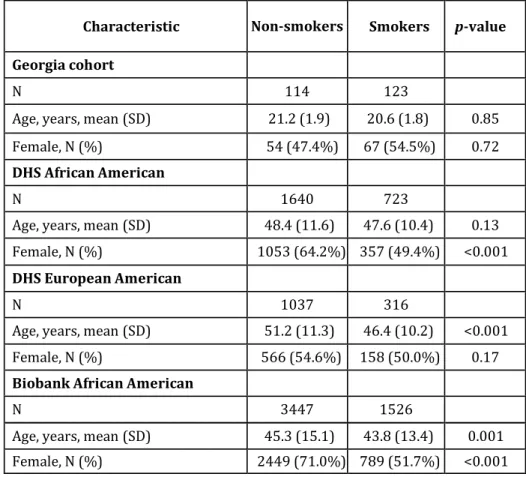
The average age of the individuals of the Georgia cohort was 20.91+/-1.95. Of the 237 participants, 123 (51.9%) were current smokers and the remaining 114 (48.1%) were non-smokers. In the Georgia cohort, no differences were found in the mean age of smokers (20.6) and nonsmokers (21.2; P=0.85). A higher, but not significant, percentage of smokers than non-smokers were female (54.4% of smokers versus 47.4% of non-smokers, P=0.72). The Dallas Heart Study population was significantly older than the Georgia cohort (mean age 48.2 and 50.1 years in AA and EA participants respectively, P<0.05). The proportion of female participants was slightly higher among DHS AA than EA participants (59.7% and 53.5%, respectively, P<0.05). DHS EA participants had a lower prevalence of smoking (23.4%) than those of either the Georgia cohort (51.9%,
32
P<0.05) or the DHS AA participants (30.6%, P<0.05). Among DHS EA participants, smokers were on average 5 years younger than non-smokers (mean age 46.4 vs. 51.2 years, respectively, P<0.001) (Table 7). There was no difference in age between AA smokers and non-smokers. In contrast to the Georgia cohort, there was a higher proportion of women among non-smokers in both ethnicities in DHS (64.2% vs. 49.4% in AA, P<0.001; 54.6% vs. 50.0% in EA, P>0.05). The Dallas Biobank population was older than the Georgia population (mean age 44.8, P<0.001) but younger than both the DHS AA and EA participants (P<0.05). In addition, the Biobank included a higher proportion of females than either the Georgia or DHS AA/EA participants (65.1%, P<0.05). The fraction of individuals who were smokers was lower in this population compared to the Georgia cohort (30.7% vs. 51.9%, P<0.001) but similar to the DHS AA participants (P>0.05). In the Dallas Biobank population, smokers were slightly younger than non-smokers (mean age 43.8 vs. 45.3, P=0.001). In addition, smokers had a lower percentage of females than non-smokers (51.7% vs. 71.0%, P<0.001, Table 7).
Table 7. Characteristics of the Georgia, DHS and Biobank participants by smoking status.
Characteristic Non-smokers Smokers p-value Georgia cohort
N 114 123
Age, years, mean (SD) 21.2 (1.9) 20.6 (1.8) 0.85
Female, N (%) 54 (47.4%) 67 (54.5%) 0.72
DHS African American
N 1640 723
Age, years, mean (SD) 48.4 (11.6) 47.6 (10.4) 0.13
Female, N (%) 1053 (64.2%) 357 (49.4%) <0.001
DHS European American
N 1037 316
Age, years, mean (SD) 51.2 (11.3) 46.4 (10.2) <0.001
Female, N (%) 566 (54.6%) 158 (50.0%) 0.17
Biobank African American
N 3447 1526
Age, years, mean (SD) 45.3 (15.1) 43.8 (13.4) 0.001
33
4.2 Menthol cigarette preference among African-Americans and European-Americans
Preference for menthol cigarettes was analyzed in both the Schroeder African-American population and in the DHS EA and AA populations.
The average age of the individuals belonging to the Schroeder population was 45.1 (SD=10.8) and the majority of them (406, 56.5%) were menthol smokers, with the remaining 312 (43.5%) being non-menthol smokers. A higher percentage of menthol than non-menthol smokers were female (39.6% vs. 24.2%, p=0.001), in agreement with previously reported data (Caraballo et al. 2011). No differences were found in the mean age of menthol smokers (45.4, SD=11.0) and non-menthol smokers (44.6, SD=10.6; p=0.372). Lastly, the distribution of the total WISDM items score did not differ between menthol (57.70, SD=23.36) and non-menthol (57.39, SD=23.6) smokers (p=0.86).
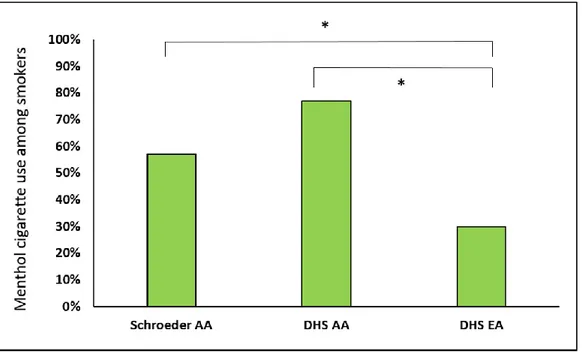
A large difference in mentholated tobacco use was found between the Schroeder and DHS African American subjects and DHS European-Americans (57% and 77% versus 30%, respectively; p=8.1e-21, Figure 6). This confirms previous findings regarding menthol cigarette use in different U.S. ethnic groups (Caraballo et al. 2011).
Figure 6. Menthol cigarette use among African-American (AA) and European-American (EA) smokers of the Schroeder and DHS populations.
34
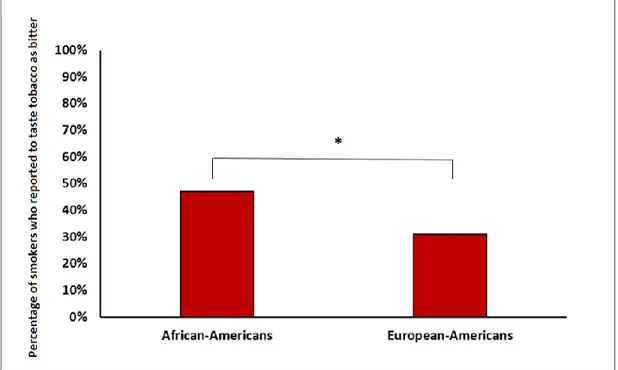
Moreover, when asking how bitter tobacco tasted, African American subjects perceived tobacco products to be more bitter than non-African individuals (47% versus 31%, p=0.001, Figure 7).
Figure 6. Self-reported bitter taste sensitivity to tobacco in African-American and European-American individuals.
4.3 Polymorphic variations at the TRPM8, TRPA1 and TAS2R38 loci
TRPM8 and TRPA1 polymorphisms were initially investigated by sequencing the
entire coding regions of these genes (e.g. 27 exons each), plus evolutionary conserved intronic regions, in the Schroeder African-American individuals. As a result of this analysis, we identifed a total of 238 polymorphisms (140 at the
TRPM8 locus and 98 at TRPA1, respectively) with minor allele frequencies
ranging from less than 0.01 to 0.50. All the identified variations were biallelic SNPs, and no insertions nor deletions were observed. In addition, 13 and 11 singletons (nucleotide changes observed only once in the total sample) were identified in these two genes, respectively. FST values indicated average low
35
levels of genetic differentiation at TRPM8 and TRPA1 loci (0.06 and 0.04, respectively), consistent with the generally low levels of nucleotide diversity (0.06 and 0.05, respectively) observed.
Eleven single nucleotide polymorphisms were found in TAS2R38 by completely sequencing its coding region in all the analyzed populations. A complete list of identified variants, with relative minor allele frequencies, is shown in Table 8.
Table 8. Single nucleotide polymorphisms identified in the TAS2R38 gene. Chr, chromosome; Pos, position; GRCh37, Human assembly version 37; MAF,
minor allele frequency.
dbSNP ID Chr Pos (GRCh37) MAF rs10246939 7 141672604 0.48 rs114288846 7 141672670 0.02 rs1726866 7 141972905 0.34 rs140262989 7 141672752 <0.01 rs139843932 7 141673087 <0.01 rs150209521 7 141673251 <0.01 rs138869704 7 141673286 <0.01 rs115966953 7 141673299 <0.01 rs713598 7 141673345 0.47 rs141196803 7 141673384 <0.01 rs148448145 7 141673397 <0.01
Haplotype phasing of the genomic DNA sequence data predicted six major haplotypes (PAV, AVI, AAI, AAV, PVI and PAI), with frequencies of 45.47%, 33.22%, 17.90%, 2.37%, 0.76% and 0.28%, respectively. In addition, the identified rare variants (e.g. MAF<1%) contributed to form seven sub-haplotypes, illustrated in Table 9.
36
Table 9. Major and sub-haplotypes identified in the TAS2R38 gene.
Major haplotype Sub-haplotype PAV PAV + rs141196803 PAV PAV AAV AAV AAI AAI AAI AAI + rs138869704 AAI AAI + rs114288846 AAI AAI + rs148448145 AAI AAI + rs139843932 AAI AAI + rs150209521 AVI AVI AVI AVI + rs115966953 PVI PVI PAI PAI
The three major TAS2R38 SNPs (rs714598, rs1726866 and rs10246939) showed approximately the same global FST (0.05, 0.06 and 0.04 respectively) and
nucleotide diversity (0.06, 0.07 and 0.05 respectively) values.
4.4 Admixture levels among African-American smokers
Genome-wide ancestry estimates of African-Americans show, on average, proportions of ~75% African, ~24% European and ~1% Native-American ancestry, although with some differences across US states (Bryc et al. 2015). To better characterize our population sample, we calculated admixture levels in a representative sample of our African-American individuals, in order to exclude any potential ancestry differences between smokers and non-smokers that could introduce a bias in our association analyses. As shown in Figure 7, the average levels of African admixture in the Schroeder population were lower (59%) than the many previously reported levels, and these subjects carried a corresponding
37
higher percentage (40%) of European admixture, with an identical proportion (1%) of Native-American admixture. However, when analyzing differences between menthol cigarette smokers and non-menthol cigarette smokers, no differences were found (60% vs. 59% African ancestry, 39% vs. 40% European ancestry and 1% vs. 1% Native-American ancestry, respectively; p=0.98).
Figure 7. Ancestry estimates of African-Americans of the Schroeder population, and reference populations from the 1000 Genomes Project using Principal
Component Analysis.
Similarly, when calculating ancestry estimates for the DHS African-Americans, no differences in ancestry distribution were noted either between smokers and non-smokers (p=0.78) and between menthol cigarette smokers and non-menthol cigarette smokers (p=0.83).
38
4.5 Associations between TAS2R38 haplotypes, PTC tasting-status and smoking
Sensitivity to the bitter compound PTC in the Georgia cohort was measured using PTC paper strips. Taster individuals reported the bitter taste of these papers-strip to be mild or strong” and non-taster subjects reported “no taste” at all. The frequency of TAS2R38 haplotypes and diplotypes differed between PTC tasters and non-tasters in this cohort, where PAV (the “taster” haplotype) was the predominant haplotype in those with the phenotype of PTC-tasters (95.3%) and rarely present in PTC non-tasters (4.7%) (p<0.001). Most of the PAV/PAV homozygotes in this cohort were PTC-tasters (98.1%) as opposed to non-tasters (1.9%) (p<0.001). PTC tasting abilities also differed between smokers and nonsmokers: 71.5% of smokers were PTC tasters, while 82.5% of non-smokers were PTC tasters (p= 0.03), suggesting a potential connection between this particular bitter taste sensitivity and smoking behaviors.
To further explore this possibility, we examined the frequency of TAS2R38 haplotypes in all the available cohorts. As a result, we noted a trend toward a difference between smokers (38.4%) and non-smokers (43.1%) in the Georgia cohort, although this was not significant (p=0.31) in this small group (N=237). We also noticed a possible trend toward a difference in the distribution of
TAS2R38 AVI (non-taster) haplotype between smokers and non-smokers (55.3%
and 49.9% respectively), but again this result was not significant (p= 0.29) in this small sample. For this reason, we expanded the analysis to the DHS and Biobank cohorts, which comprise a total of 8689 individuals. As shown in Table 10, in the DHS European-American cohort, the frequency of the taster PAV haplotype was lower in smokers (37.0%) than in non-smokers (44.0%) (p=0.003). Conversely the frequency of the non-taster AVI haplotype was higher in smokers (58.7%) compared to non-smokers (51.5%) (p=0.002). In order to replicate this association in a sub-sample of individuals more comparable to the Georgia cohort in demographic characteristics, we repeated this analysis in DHS EA individuals<40 years of age (N=272). The observed differences in TAS2R38 haplotypes frequencies between smokers and non-smokers in this subgroup were similar to those in the entire population (PAV haplotype frequency 35% in smokers vs 44% in nonsmokers, p=0.05; AVI haplotype frequency 60% in
39
smokers vs. 51% in non-smokers, p=0.06). Interestingly, none of the TAS2R38 haplotypes differed in frequency between smokers and nonsmokers in African-Americans in either the DHS or Biobank populations (p’s>0.05). Pooling the data for AA participants from the DHS and Biobank populations and EA participants from the DHS and Georgia populations confirmed our previous un-pooled analyses. In particular, combining the results by meta-analysis showed no association between TAS2R38 haplotypes and current smoking in African-American individuals (p>0.05). For the European-African-American cohorts, we confirmed the associations found in the two independent cohorts with the PAV
(p=0.001) and the AVI (p=0.001) haplotypes.
Table 10. Distribution of TAS2R38 haplotypes between smokers and non-smokers in the DHS population.
To explore potential associations between other polymorphisms in the TAS2R38 gene and menthol cigarette preference, we sequenced the entire coding region of this gene in the Schroeder population. The TAS2R38 major haplotypes showed a different distribution between menthol and non-menthol smokers. The frequency of the TAS2R38 AVI haplotype was significantly higher in non-menthol smokers compared to menthol smokers, even after correction for covariates and multiple testing (OR=0.69, p-adjust=0.008). This association was replicated in both female (OR=0.89, p=0.03) and male (OR=0.72, p=0.02) individuals. The PAV
40
haplotype was not significantly associated with menthol smoking, although the results approached significance (OR=1.24, p=0.06). Lastly, construction of the haplotype network showed that, in addition to the major AVI haplotype, the
TAS2R38 H11 sub-haplotype (AVI + SNP rs115966953) showed a different
distribution between menthol and non-menthol smokers (Figure 8). However, there were only 5 carriers of the sub-haplotype and this association did not reach significance (p=0.38).
Figure 8. Haplotype network of TAS2R38 haplotypes and sub-haplotypes. Menthol smokers are represented in light green and non-menthol smokers are represented in black. The size of each circle corresponds to the frequency of each haplotype. Red numbers indicate the site and number of nucleotide substitutions separating different haplotypes. The asterisks indicate a statistically significant difference in distribution between menthol and non-menthol smokers. H1-H13
41
4.6 Meta-analysis of the association between TAS2R38 variants and menthol cigarette preference
To better explore the strength and replicability of our findings, we performed a meta-analysis of the association between TAS2R38 haplotypes and menthol cigarette smoking. This was possible because the phenotypes collected for the menthol studies were comparable, unlike those for other smoking behaviors. For this purpose, we included the results of both the present study and that of Oncken et al. (2015). As shown in Figure 9, the association between TAS2R38 PAV haplotype and menthol cigarette smoking was still significant (p=0.025, using a random effects model) resulting in a common OR of 1.78 (95% confidence interval = 1.07 to 2.94), with some evidence (p=0.019) of expected heterogeneity, considering the differences in subject characteristics.
Figure 9. Forest plot illustrating the odds ratios and confidence intervals of the TAS2R38 PAV haplotype association with menthol cigarette smoking.
42
4.7 Associations between TRPM8, TRPA1 variants and menthol cigarette smoking
In order to further explore the genetic contributions to menthol preference in cigarettes, polymorphisms in the TRPM8 and TRPA1 menthol receptors were examined in both menthol and non-menthol cigarette smokers. Of the 238 analyzed SNPs in TRPM8 and TRPA1 (140 and 98, respectively), three SNPs were found to be strongly associated with menthol cigarette smoking in the Schroeder population, even after multiple testing correction (Figure 10). In particular, two intronic TRPM8 SNPs (rs28902186 and rs11563124) and one intronic TRPA1 SNP (rs35427625) were associated with menthol cigarette preference (OR=6.1,
p=3.12E-09; OR=2.52, p=1.51E-03 and OR=0.5 and p=1.22E-05, respectively).
The frequency of the two TRPM8 SNPs was low (MAF=0.01 and 0.03, respectively) with the derived allele of rs28902186 (T) being only present in African populations of the 1000 Genomes populations, where it reached frequencies up to 0.09. These two SNPs were in linkage equilibrium, highlighting that these two associations were independent from each other. The frequency of the intronic TRPA1 SNP (rs28736596) was high (MAF=0.43) and not in linkage disequilibrium with any SNPs in TRPA1 coding regions. Although these two associations were intriguing, we were not able to replicate them in the DHS population (p>0.05).
Figure 10. Associations between TRPM8 and TRPA1 variants and menthol cigarette smoking. The first horizontal line (red) indicates a nominal p-value of
0.05, the second horizontal line (black) indicates the significance level after Bonferroni correction.