2
TABLE OF CONTENTS
RATIONALE
Pag. 5
GPER agonist G-1 decreases adrenocortical carcinoma (ACC) cell growth in vitro and in vivo.
Background Pag.9
Adrenocortical cancers Pag.10
Epidemiology Pag.11
Adrenocortical adenoma Pag.11
Adrenocortical carcinoma Pag.11
Pathogenesis Pag.14
Role of ERα and ERβ activation on tumor development Pag.15
G Protein Coupled Estrogen Receptor: GPER and its ligand Pag.17
GPER-dependent cellular functions Pag.17
Identification and characterization of GPER-selective ligands Pag.18
Transcriptional activations mediated by GPER Pag.21
Aim of the study Pag.22
Materials and Methods Pag.23
Cell culture and tissues
Pag.24
RNA extraction, reverse transcription and real time PCR
Pag.24
Western Blot analysis Pag.25
Histopathological and Immunohistochemical analysis Pag.25
Cytochrome c detection Pag.26
Cell cycle analysis and evaluation of cell death Pag.26
Caspases 9 and 3/7 Activity Assay Pag.26
TUNEL assay Pag.27
3
Assessment of cell proliferation Pag.27
Gene silencing experiments Pag.28
Xenograft model Pag.28
Scoring system Pag.29
Data analysis and statistical methods Pag.29
Results Pag.30
H295R cell growth inhibited by G-1 treatment in vitro and in vivo Pag.31
G-1trattment causes cell cycle arrest and cell death in H295R Pag.35
G-1 causes cell nuclei morphological changes, DNA damage and apoptosis Pag.36
G1 treatment causes sustained ERK1/2 phosphorylation Pag.38
Discussion Pag.39
GPER agonist G-1 decreases adrenocortical carcinoma (ACC) cell growth Pag.40
Determination of mercury through TDA-AAS TECHNIQUE for Human Biomonitoring activity.
Background Pag.42
Mercury Pag.43
Mercury cycling Pag.44
Routes of exposure Pag.47
Toxicokinetic Pag.50
Human Biomonitoring Pag.54
Biomarker Pag.56
Hair Pag.58
Urine Pag.59
Regulation and guidelines Pag.60
Analytical methods Pag.60
4
Materials and Methods Pag.63
Methodologies Pag.64
Sampling Pag.64
Questionnaire eating habits Pag.65
Treatment of the samples Pag.65
Techniques Pag.66
DMA-80 Tricell Pag.66
Validation method Pag.68
Exposure assessment via biomonitoring Pag.69
Extrapolation of results Pag.69
Results Pag.71
Accrediting method Pag.72
Sample selection and recruitment strategies Pag.76
Discussion Pag.80
5
RATIONALE
During the first part of my PhD program, carried out in the “Biologia Cellulare ed Applicata” laboratory of University of Calabria directed by Prof. Vincenzo Pezzi, investigated the role of functional cross-talk between IGF - II / IGF1R and estrogen receptors in Adrenocortical Carcinoma (ACC) growth. In particular the role of G Protein Coupled Estrogen Receptor (GPER) in ACC growth. In the second part of the program I was included in the project of the Ministry of Health "Osservatorio per l’ILVA" through a partnership concluded between University of Calabria and National Institute for Health (ISS) in Rome. We developed and credited an analytical method for the determination of mercury through the TDA-AAS technique (Thermal Decomposition Amalgamation Atomic Absorption Spectrometry). This method used a mercury direct automatic analyzer DMA-80TRICELL (Srl Milestone, Sorisole, Italy) and it was applied for Human Biomonitoring activity expected by project.
GPER agonist G-1 decreases adrenocortical carcinoma (ACC) cell growth in vitro
and in vivo
ACC is a very rare tumor accounting for 0.7-2.0 cases/million people per year with an increased incidence in the first and fourth-fifth decades of life. By gender, females are the most affected (55-60%) (Else et al., 2014). The cornerstones in the pathogenesis of ACC are considered to be the genetic alterations of the IGF-2, p53 and β-catenin molecular pathways (Barlaskar et al., 2007; Ragazzon et al., 2011). More than 85% of ACC showed allelic losses (LOH) at the TP53 locus (17p13)(Bertherat and Bertagna 2009). Additionally, other genes, such as ZNFR3, identified by a genome-wide study, appear potentially involved in the tumorigenesis of ACC (Assié et al., 2014). Most frequently genetic alterations (90 % of cases ) (Barlaskar et al. 2008) associated to ACC is the loss of region imprinted on locus 11p15 resulting in excess of insulin growth factor II ( IGFII ) expression. IGFII effects are mediated through its receptor IGF1R resulting in activation of the PI3K/AKT/mTOR cascade, the RAS/MAPK and the PLC/PKC pathways (Pollak, 2008), this demonstrate the important role of IGF system in ACC. However, Adrenocortical cancer is a disease extremely heterogeneous and this new pharmacological approach could not be enough for the therapy of all forms of ACC. To improve diagnosis, prognostic evaluation and treatment of different types of tumours is important understand the pathophysiology. Professor Pezzi’s group have demonstrated that ACCs are characterized by ERα up-regulation and aromatase (the enzyme
6
involved in the production of estrogens using androgens as substrate) over-expression (Barzon et al 2008). They highlight that estradiol improves proliferation in cell line H295R, whereas antiestrogens upregulate ERβ and inhibit ACC cell growth ( Montanaro et al., 2005). It is known that tamoxifen and its metabolite 4-hydroxytamoxifen not only exercise antiestrogenic activity. OHT, in fact, is able to modulate the downstream pathway of GPR30 (Montanaro et al., 2005; Vivacqua et al., 2006a). This receptor, when activated by OHT, mean rapid molecular signaling of non-genomic type similar to those induced by estradiol (Lappano et al.,. 2013; Prossnitz et al., 2009; Vivacquaet al., 2006a.) which include the mobilization of intracellular Ca2+, stores and activation of mitogens activated protein kinase (MAPK) and the involvement of pathway-responsive of phosphoinositide 3-kinase (PI3K) (Prossnitz et al., 2009; Ariazi et al., 2010). GPER can modulate growth of hormonally responsive cancer cells (Vivacqua, et al.,2006b) and it exhibits prognostic utility in endometrial ( Smith et al., 2007), ovarian ( Smith et al., 2009), and breast cancer ( Filardo et al., 2006). A non-steroidal, high-affinity GPER agonist G-1 (1-[4-(6-bromobenzo [1, 3]dioxol-5yl)-3a, 4, 5, 9b-tetrahydro-3H-cyclopenta-[c]quinolin-8-yl]-ethanone) has been used to distinguish GPER-mediated estrogen responses from those mediated by classic estrogen receptors ( Bologa et al., 2006)). G-1 biological effects appear cell type specific and dependent on the ERs expression pattern ( Chimentoet al. 2013a; Chimento et al., 2013b; Chimento et al.2012; Chimento et al., 2010; Chimentoet al., 2011). Using G-1, we investigated the role of GPER activation on ACC growth.
Determination of mercury through TDA-AAS TECHNIQUE for Human
Biomonitoring activity
Mercury (Hg) is a dangerous heavy metal and its presence in the environment and in the human food chain is a matter of increasing concern. Metallic mercury is liquid at room temperature but mercury vapor are more dangerous than liquid form. Hg bind different elements forming inorganic mercureos compounds (Hg+) or mercuric compounds (Hg2+). In this way Hg moves in to the environment following the normal breakdown of minerals in rocks and soil due to exposure to wind and water, natural degassing of the earth's crust, evaporation of the oceans and volcanic activity (Hsiao et al., 2011; Sun et al., 2013). A good part of this metal derived from anthropogenic sources increased by human activities since the start of the industrial era (Mohmand et al., 2015).Among these are included the emissions derived from gold mining and the fusion of metals (gold, copper, zinc), coal combustion, incinerators and chlor-alkali industries. Existing three forms of this metal: organic, mostly as methyl-mercury (MeHg), inorganic and elemental. MeHgenters the food chain
7
through fish who takes it through the plankton. This biomagnification determines human exposure to the metal through the consumption of this type of products. The general population may be result exposed to mercury through diet, through the work (occupationally exposure) and in accidental way with medical equipment and amalgam fillings (accidentally exposure). Mercury is toxic and have not physiologic function in human body. Acute and chronic exposure to Hg can rise a wide range of effects, e.g., inattention, memory disturbance, learning problems, impairment of social behaviour, low intelligence quotient and other serious health consequences (Stein et al., 2002). Mercury vapor at high concentration inhalation may cause corrosive bronchitis and acute interstitial pneumonia with following clinical symptoms: neurasthenia, tremor, increased swelling of the thyroid and uptake of iodine, gingivitis tachycardia, hematological disorders and increased urinary excretion of the metal. Regarding to inorganic mercury the kidney is the main target organ. High doses of the metal are toxic for cells of the renal tubules, while, low doses chronic exposure can induce glomerular immunological pathology. Exposed can subjects show a reversible proteinuria.
In human the principal problems of MeHg exposure is the neurotoxicity. Methyl-mercury, in fact, is able to crossing blood–brain barrier by an amino acid carrier and readily accumulates in the brain (Kerper et al., 1992) as well as it is able to cross the placenta and accumulates in fetal blood and brain. Clinical manifestation include paresthesia, ataxia, neurasthenia loss of sight and hearing, tremor and difficulty in speaking. Toxicity can even lead to death as a result of cerebral edema with destruction of the gray matter and gliosis determined by brain atrophy. The high affinity of the divalent mercury for sulfhydryl groups of proteins is a major mechanism of damage non-specific and / or cell death. They are, however, involved more general mechanisms like neurotransmitter production and secretion, uptake and metabolism, cell signaling, protein, DNA and RNA synthesis, respiratory and energy-generating systems, the neuronal migration, cell division and the formation of microtubules (Castoldi et al., 2001; Clarkson et al., 1993; WHO, 1990). MeHg characteristics in term of biomagnification, ability to enter in food chain and its toxicokinetics make this species the most dangerous for human health. To quantified MeHg in the subjects we used as biomarker the hair. This choice was made because sulfur-containing proteins rich in the hair bind to MeHg (WHO, 1990). Once incorporated, Hg does not return to the blood, thus, it provides a good long-term marker of exposure. Moreover, hair is a biological specimen that is easily and noninvasively collected, with minimal cost, and it is easily stored and transported to the laboratory for analysis. Mercury concentration is generally evaluated by different techniques such as the cold vapor atomic fluorescence spectroscopy (CV-AFS) (Adlnasab et al., 2014.; Brombach et al., 2015; Aranda et al., 2009), cold vapor atomic absorption spectroscopy (CV-AAS) (Balarama Khrisna and Karunasagar, 2015), inductively coupled plasma atomic emission spectrometry (ICP-AES) (Bidari et al., 2012)
8
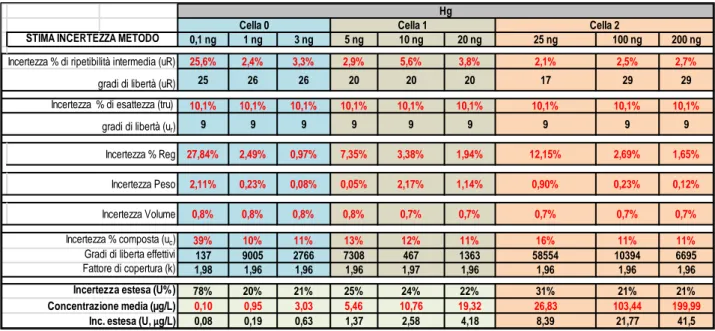
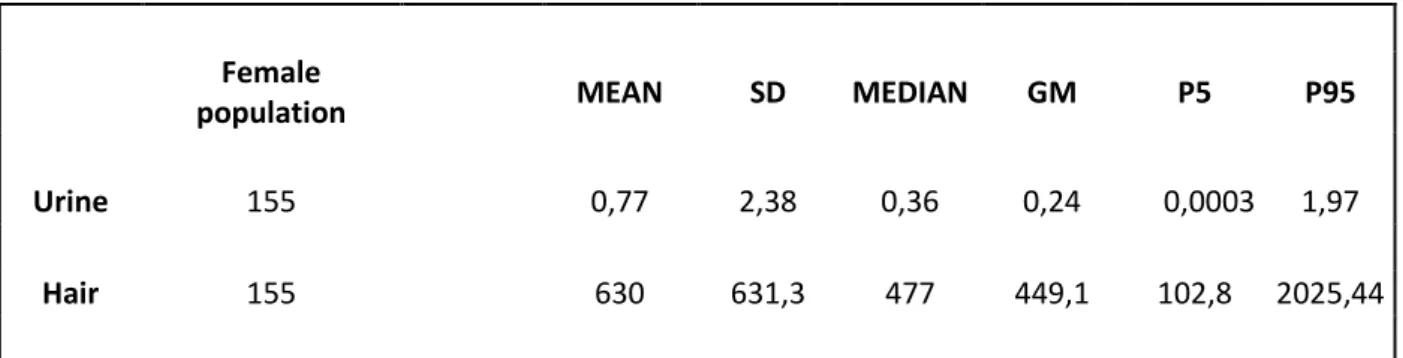
and inductively coupled plasma mass spectrometry (ICP-MS) (Lin et al., 2015). All these techniques are sensitive, precise and supply reliable and reproducible data but involving pretreatment sample with contamination risk. The use of the thermal decomposition amalgamation atomic absorption spectrometry (TDA-AAS) allows to decrease the preparative steps number and contamination risk, in addition to this, it reduce the time and cost of analysis. In this context, a TDA-AAS instrument was adopted, in according to US-EPA 7473 method. This is a certified method containing general information on how to perform an analytical procedure or technique which a laboratory can use as a basic starting point for generating its own detailed standard operating procedure (SOP). It was created a confirmatory method based on EPA7473 to satisfy the requirements of quality system (UNI CEI EN ISO / IEC 17025). They were conducted tests in order to assess the performance qualities as regards repeatability, accuracy, limit of detection and quantification (LoD and LoQ). Furthermore to respect UNI CEI EN ISO / IEC 17025 we identified all the components of uncertainty and further provided a reasonable estimate of their contribution. Then we used this confirmatory method in population study, involved 300 healthy individuals living in an urban area of South Italy, for the determination of Hg in hair and urine using a Direct Mercury Analyzer® (DMA-80 Tricell; Milestone Inc., Italy). Our population study is a part of the biomonitoring campaign planned by the Ministry of Health in the project "Osservatorio per l’ILVA".
9
GPER agonist G-1 decreases adrenocortical carcinoma (ACC) cell growth in vitro
and in vivo
10
Adrenocortical cancers
ACC is a neoplastic disease with a poor prognosis. Current studies in this field have indicated the need for a multidisciplinary approach in the management of this tumor (Creemers et al., 2016; Stigliano et al., 2016). Surgery remains the most effective treatment choice for the primary tumor or for the removal of isolated metastases (Else et al ., 2014;Crucitti et al., 1996). The experience that at least one-third of patients show loco-regional recurrence or distant metastases even after a radical surgical excision introduced the concept of adjuvant therapy in these patients (Donatini et al., 2014). Despite an extensive surgical resection, the survival rate of these patients is estimated as ~50% after 5 years (Vaughan, 2004). Although these data support the need for an adjuvant cancer therapy. At present, mitotane represents the only drug approved in Europe and in the United States for ACC treatment; but opinions regarding its use are still highly discordant (Huang and Fojo, 2008). Tumors that originate from the adrenal cortex can be divided into benign adenomas and malignant adenocarcinomas that can be associated to an endocrine component (Allolio and Fassnacht, 2006). ACC in fact can be asymptomatic, it can be manifest with a mass (Brennan, 1987) or it can be characterized by endocrine syndrome. Generally ACC presented an immature steroidogenesis with hormonal precursor excess but, 60% of all ACC patients presented signs and symptoms (“functional tumors”)( Schulick and Brennan, 1999a; Schulick and Brennan, 1999b) related to type of hormone produced in excess:
• Cushing's syndrome, caused by hypersecretion of cortisol; • Conn's syndrome, caused by aldosterone hypersecretion;
• hirsutism and virilization, caused by hypersecretion of androgens
Obliviously it is clear that differential diagnosis between adrenocortical adenoma and ACC is of crucial clinical relevance, because the prognosis and clinical management of benign and malignant adrenocortical tumors is entirely different. It is very difficult to establish malignancy adrenal tumors based on its size with the available imaging techniques. Currently in use guidelines recommended to remove adrenal tumors with a diameter of >6 cm, because they presented a risk of malignancy >25% (Aron et al., 2012). Hormonal features can also be used in diagnosis, for example recent data using urinary steroid hormone metabolomics showed characteristic patterns of steroid secretion and metabolism in ACC samples (Arltet al., 2011). Novel markers of malignancy are intensively searched using bioinformatics approaches to define an early and specific differential diagnosis between ACC and ACA since the histological diagnosis of malignancy is often difficult (Patalano et al., 2009).
11
Epidemiology
ACC is a rare solid tumor (Kebebew et al., 2006; Wajchenberg et al., 2000) with an incidence of 1– 2 per million population (Allolioet al., 2003; Dackiw et al., 2001; Wajchenberg et al., 2000) as opposed to adrenal incidentalomas that have a prevalence of at least 3% in a population >50 years of age (ACC constitute <5% of all adrenal incidentalomas) (Barzon et al., 2003; Bovioet al., 2006; Grumbach et al., 2003; Mansmann et al., 2004; Song et al., 2007). ACC affects women more commonly than men with a ratio of 1.5:1 (Bilimoria et al., 2008; Dy, 2013; Koschkeret al., 2006; Roman, 2006; Wooten and King, 1993). Females with ACC are more likely to have functional tumors while men with ACC have bimodal age distribution, with a first peak in childhood (<5 years) and a second higher peak in the fourth and fifth decades with non-functional tumors (Brennan, 1987; Cohn et al., 1986; Koschker et al., 2006; Schulick and Brennan, 1999; Wajchenberg et al., 2000).
Adrenocortical adenoma
The adrenocortical adenoma is a benign neoplasm of adrenal cortical cells. The type of hormone secreted influenced the dimensions:
• adenoma with hyperaldosteronism is usually unilateral and of yellowish color, around 1.5 cm of size and is not encapsulated;
• adenoma with hypercortisolism is unilateral, has dimensions of about 4 cm, is yellow-brown and is encapsulated;
• adenoma with virilization is unilateral, has dimensions of about 5 cm, is red-brown and is encapsulated.
The color of the tumour is due to the stored lipid (mainly cholesterol), from which the cortical hormones are synthesized. The adrenocortical adenoma can present with primary aldosteronism (overproduction of the aldosterone by the adrenal gland) or Cushing’s syndrome (signs and symptoms associated to exposure to high levels of cortisol). Only a very small percentage of these tumors leads to Cushing's syndrome, in fact, most of they are casually findings at post mortem examination commonly; Most adrenocortical adenomas produced no significant metabolic disorder.
Adrenocortical carcinoma
ACC is a rare and highly aggressive tumor. We can histologically distinguish: solid or trabecular areas with fibrous bands interposed between the tumor nodules, necrosis, the presence of large cells with vacuolated cytoplasm, nucleus atypical and hyperchromatic, prominent nucleoli, frequent mitosis, vascular and capsular invasion. It is highly aggressive: about 60% of patients have
12
metastases at diagnosis, with a 5-year survival rate of 8% for recurrent and inoperable disease. In the case of endocrine cancer, it is associated withCushing's syndrome. The therapeutic approach of choice for adrenocortical carcinoma is surgery conducted only after appropriate preoperative diagnostic tests, including biochemical evaluation and imaging. Suspicious features to consider for ACC are: tumors size >4 cm, functional tumor, radiologic characteristics. Surgery however is not always practicable, for example the casein which the tumor was strongly adherent to the kidney, such as to look like a single mass, although histological examination has then denied the spread to the renal parenchyma. The case in which the surgery resection is not possible or not satisfactory a chemotherapeutic treatment was associated to operation (Fig.1). The recommended first-line cytotoxic treatment regimens are etoposide, doxorubicin, cisplatin plus mitotane (Berruti et al., 2005), or streptozotocin plus mitotane (Khan et al., 2000).
Figure 1 Treatments and molecular targets in isolated cortical carcinoma and metastatic (ACC)
Mitotane are the only drug approved by the U.S. Food and Drug Administration and European Medicine Executive Agency for treatment of ACC (Schteingart et al., 2005). Mitotane is a derivative of the insecticide dichlorodiphenyldichloroethane (DDT) with adrenolytic and cytotoxic activity toward the fasciculata and reticularis adrenal areas. It inhibits steroidogenic pathways acting mainly at the level of the cholesterol side chain cleavage enzymes CYP11A1 and CYP11B1 (Lin et al., 2012; Lehmann et al., 2013). Mitotane metabolites (o',p-DDA and o',p- DDE, respectively) are the products of a hydroxylation that occurs in the liver and of which o',p-DDA represents the active form (van Slooten et al., 1984). It has indeed been shown, that o',p-DDA measurements reflect the mitotane response in treated patients (Hermsen et al., 2011). In most patients mitotane abolish steroid secretion but, since uninhibited hormone secretion might worsen
13
significantly quality of life and may even be life threatening. For its action the mitotane treatment required an endocrine symptoms control, with adrenostatic drugs (metyrapone, etomidate). Is required also a follow-up, that is repeated every 3 months for the first two years, including abdominal CT or MRI and hormonal markers, and kept on for at least 10 yr. Treatments with cisplatin and etoposide in combination with mitotane are placed among the most active for in advanced cancer. Several inhibitors of steroidogenesis were used to control deleterious effects of elevated hormone levels in ACC patients. During treatment with any of the steroidogenesis inhibitors, patients need to be regularly evaluated for adrenal insufficiency and should be regarded as adrenal-insufficient in times of physical stress (febrile illness or significant injury/surgery). Inhibition of steroidogenic pathway and adrenolytic effects are involved in control of hormone levels caused by Mitotane treatment. Usually ketoconazole and metyrapone are used to control glucocorticoid excess. Ketoconazole inhibits CYP17A1, CYP11A1, and also CYP11B1. During treatment with ketoconazole, are recommended monitoring of liver enzymes because it is an inhibitor of different hepatic drug metabolizing enzymes (eg, CYP3A4, CYP2C9, and CYP1A2) of which it could be altered the drug interaction. Another powerful steroidogenesis inhibitor at the level of CYP11B1 is metyrapone (Hartzband et al., 1988) that through inhibition of CYP11B1, increases adrenal androgens levels with worsening symptoms related to hyperandrogenemia. In subject with androgen-secreting tumors and mineralocorticoid- secreting tumors spironolactone can be used to control the effect on hormones. As with other malignancies, local control of ACC is important for effecting disease cure and for improving symptomatic outcomes. Furthermore radiotherapy, that usually was considered ineffective, have demonstrated in several recent studies to offer a significant improvement in disease control in both the adjuvant and palliative settings (Fassnacht et al., 2006; Hermsen et al., 2010). These improvement unfortunately has not been universally demonstrated (Habra et al., 2013). In recent years, considerable advances toward understanding the pathogenesis of ACT have been made using different strategies :
1. Identification of genetic alterations in rare familial syndromes and evaluation of whether the same defects are present in sporadic tumors.
2. Investigation of signaling pathways that were proved important in other tumors types.
3. Employment of high-throughput techniques such as genome wide expression profiling, methylation profiling and microRNA profiling to interrogate novel signaling pathways.
14
Pathogenesis
The molecular mechanisms involved in adrenocortical tumorogenesis are still under study beacuse poorly understood. Recent study are focused on alterations of insuline-like growth factor (IGF) system associated with these tumors. Most common alteration (90% of malignant adrenocortical tumors) is in the 11p15 region, that contain the IGF-II gene maps (Gicquel et al., 2001) (Figure 2) The tumors with these abnormalities exhibit strong overexpression of IGF-II gene (Csernus et al., 1999) and large amounts of IGF-II protein (Gicquel et al., 2001; Listrat et al., 1999). In particular, in ACC, it possible note a overproduction of The type 1 IGF receptor (Janssen et al., 1997; Wolf et al., 1997) and the IGF-binding protein-2 (IGFB-2) (Boulle et al., 1998) These evidence show the involvement of the IGF system in adrenocortical tumor progression. The IGF system comprises numerous elements such as IGFs, IGF-I and IGF-II, small polypeptides produced in various tissues.
Fig. 2. Alterations of 11p15 locus and insulin-like growth factor II (IGF-II) over-expression in adrenocortical cancer (ACC)
This system have endocrine and auto/paracrine modes of action (Gockerman et al., 1995). Type IGF-I receptor mediates most effects of the IGFs while IGF-II/mannose-6-phosphate (IGF-II M6P) have a function of internalization and degradation of IGF-II (Clemmons et al., 1995; Gockerman et al., 1995). Both IGF-I both IGF-II can bind with high affinity IGFBPs that modulate positively or negatively the effects of IGFs depending on their abundance, their affinity for the growth factors and their cellular localization. Different study confirm the involvement of IGF-II in tumorogenesis of Wilms’ tumors, hepatomas, colon carcinomas and pheochromocytomas (Karnieli et al., 1996) and in the same way IGF-II may also be involved in adrenocortical tumors.
Another mutation more frequently in adrenocortical carcinoma was detected on p53 gene (McNicol et al., 1997). Moreover, germ line mutations of p53 predispose to childhood adrenocortical cancer (Sameshima et al., 1992) (Wagner et al., 1994).These mutation were found more frequently also in other malignant tumors (Reinke V, 1997).
Adrenocortical cancer Normal adrenal cortex
15
Another metabolic pathway involved Wnt-signaling that has recently been identified as a regulator of different endocrine functions. Wnt proteins are secreted glycoproteins that bind to the N-terminal extra-cellular cysteine-rich domain of the Frizzled (Fz) receptor family and tolipoprotein receptor-related protein (LRP) co-receptors (low density LRP). Frizzled receptors are G-protein-coupled seven-transmembrane receptors. It was possible distinguishes canonical (i.e. beta-catenin) and non-canonical Wnt-signaling based on the involvement of the transcriptional co-activator beta-catenin. Wnt Binding to both receptors activates the canonical Wnt-signaling pathway. Wnt, in fact, by binding a complex containing adenomatous polyposis coli (APC) and axin determine an inhibition of glycogen synthase kinase-3 (GSK3B) with stabilization of β-catenin. Subsequently, β-catenin, a transcriptional co-activator, translocates to the nucleus to activate T-cell factor (TCF)/lymphoid enhancer factor (LEF) transcription factors on canonical Wnt target-genes.
Furthermore a mutation involved in the inactivation of the type 1 MEN1 germline is found in approximately 90% of families with multiple endocrine neoplasia type 1 (MEN1) of these 25-40% presents adrenocortical tumors and / or hyperplasia (Kjellman et al., 1999a; Yano et al., 1989) The mutation of MEN1 gene is very rare in ACC (Wales MM, 1995; Yano et al., 1989),opposed to hyperplasia that was found in patients with MEN1 who have hypersecretion of ACTH (Cushing's syndrome).
Role of ERα and ERβ activation on tumor development
A correlation between estrogen and tumor development was been suggested by epidemiological evidence and experimental studies. Adrenal tumors, in particular those secreting, are more frequent in women and the use of estrogen-progestin would seem to be a risk factor for tumor development. The presence of a cross-talk has been reported between the IGF system and estrogens in several tumoral cells. Both estrogens both IGF system are able to activate the same pathway through the action of estrogen receptors (Hamelers and Steenbergh, 2003). It has been largely demonstrated that the effects of estrogens are mediated by the ERα and ERβ, which act as transcription factors (Nilsson et al., 2001). H295R proliferation seems to be supported by an autocrine mechanism mediated by E2 through its receptors (Sirianni et al., 2012).
The assessment of response to estrogen receptor antagonists (such as ICI 182 780 and OHT (4-OH tamoxifen)) confirms the E2 involvement in H295R cell proliferation. This showed a dose-dependent inhibition of basal and E2-dose-dependent cell proliferation. In particular, OHT induced morphological changes characteristic of apoptosis up-regulating the expression of FasL and inducing autocrine activation of caspases. ICI, while, caused a cytostatic effect that could be explained by the inhibitory effects exerted by ICI on IGF signaling pathway. Pathway that is
16
strongly activated in H295R through the IGFIR by autocrine IGF-II action (Sirianni et al., 2012). ICI mediated inhibition of cell growth is not solely attributable to competition for the estrogen receptor but also to the interruption of the IGF signaling pathway (Sirianni et al., 2012).
ERα and ERβ belonging to steroid/thyroid hormone superfamily of nuclear receptors, and share a common structural architecture (Evans, 1988; Katzenellenbogen and Katzenellenbogen, 1996; Tsai and O'Malley, 1994). These receptor have three independent but interacting functional domains: the NH2-terminal or A/B domain, the C or DNA-binding domain, and the D/E/F or ligand-binding domain. Al these domains interact with each other. Binding of estrogens to ER triggers conformational changes in the receptor influencing the rate of transcription of estrogen-regulated genes. These steps include receptor dimerization, receptor-DNA interaction, recruitment of and interaction with coactivators and others transcription factors, over and above formation of a preinitiation complex (Katzenellenbogen and Katzenellenbogen, 1996; McKenna et al., 1999). Another striking difference between the two receptors is their distinctive responses to the synthetic antiestrogens tamoxifen, raloxifene, and ICI-164,384.In particular on an ERE-based reporter gene, these ligands are partial E2 agonists with ERα but are pure E2 antagonists with ERβ (Batistuzzo de Medeiros et al., 1997; McDonnell et al., 1995; McInerney et al., 1998). On these interactions COOH-terminal, E/F-, or ligand-binding domain (LBD) intermediates ligand binding with consequently receptor dimerization, nuclear translocation, and transactivation of target gene expression (Eudy et al., 1998; Giguere et al., 1988; Tsai and O'Malley, 1994). Crystallographic studies with the LBDs of ERα and ERβ revealed that the position of helix 12 is altered by binding of ligands. When the ERα LBD is complexed with the agonists, E2 or diethylstilbestrol (DES), helix 12 is positioned over the ligand-binding pocket and forms the surface for recruitment and interaction of coactivators (Shiau et al., 1998; Wurtz et al., 1996). In contrast, in the ERα- and ERβ-LBD complexes with raloxifene (Pike et al., 1999) or the ERα-ERβ-LBD 4-OH-tamoxifen complex (Shiau et al., 1998), helix 12 is displaced from its agonist position over the ligand-binding cavity Hence different ligands induce different receptor conformations (McDonnell et al., 1995; Paech et al., 1997) and the positioning of helix 12 is the key event that permits discrimination between estrogen agonists (E2 and DES) and antagonists (raloxifene and 4-OH-tamoxifen). Typical tumoral condition show levels of ERβ significantly lower, conversely ERα up-regulation and aromatase over-expression. In addition, the expression of ER was correlated with the expression of nuclear hormone receptors, suggesting a correlation in the modulation of ER. Finally these evidence suggest that estrogen produced locally by aromatase can induce the proliferation of adrenocortical cells through autocrine and paracrine mechanisms and offer new perspectives on the potential use of
anti-17
estrogens and aromatase inhibitors as therapeutic agents against adrenocortical carcinoma (Barzon et al., 2008).
G Protein Coupled Estrogen Receptor: GPER and its ligand
Estrogen supports different biochemical pathways that were distinguished in rapid or “pregenomic” events (second messenger and protein/lipid kinase activation) that occur within minutes of estrogen exposure and delayed or genomic transcriptional responses that have more a slowly mechanism of action. Estrogen receptors (ER) belong to the nuclear steroid hormone receptor superfamily. We can distinguishes ERα and ERβ, which function as hormone inducible transcription factors with estrogen dependent gene transactivation. Tamoxifen (TAM) a selective estrogen receptors modulators was designed to block estrogen-ER binding, and it was widely and effectively clinically used in the treatment of breast cancer. An active metabolite of TAM, the hydroxytamoxifen, is capable to activate a transmembrane estrogen receptor named GPER. This seven-transmembrane G-protein-coupled receptor (GPCR) is able to mediate rapid estrogen signaling in different cell types (Prossnitz and Maggiolini, 2009). The signaling mechanisms employed by GPER that allow stimulation of adenylyl cyclase and release of membrane tethered epidermal growth factor (EGF) are not typical to GPER but are common to many other GPCR (Filardo and Thomas; 2005). In the past, numerous studies, have demonstrated estrogen signaling in GPER positive, ER negative cells indicate that GPER can act as a “stand alone” receptor. ER and GPER are correlated in different signaling mechanisms in reproductive cancer, but their action are also indipendent for several measures such as Er and GPER show independent expression in breast tumors and in cultured breast cancer cells lines(Filardo et al., 2006; Revankar et al., 2005.). Furthermore they have different binding affinities for various estrogens and are differentially activated by them (Blair et al., 1999) and some of GPER agonists are ER antagonists (Filardo 2011).
GPER-dependent cellular functions
GPER was an orphan member of the 7-transmembrane receptor family (Carmeci et al., 1997; O'Dowd et al., 1998; Owman et al., 1996; Takada et al., 1997). Based on the amino acid sequence homology, GPER bore the most similarity to the chemokine subfamily of GPCRs. Matching expression of GPER in a number of ER-positive (MCF7) and ER-negative (MDA-MB-231) cell lines and tissue revealed a strong positive correlation between ER and GPER expression, highlighting a link to physiologic responses into estrogen-responsive tissues and cancers (Carmeci et al., 1997). The role of GPER in the rapid activation of MAPKs by estrogen in breast cancer cells was investigated (Filardo et al., 2000). The correlation between GPER and functional response to
18
estrogen was demonstrated by Estrogen-mediated activation of Erk 1/2 in ER-negative cells as well as in GPER-transfected cell. However the pathway that involved this receptor was used by the ER antagonist, ICI 182, 780, for MAPK activation. Study results suggested that ER-negative cells could maintain responsiveness to estrogen through the expression of GPER (Filardo, 2002). Over the past years, a small number of papers related to GPER reported upregulating of GPER expression by progestin in MCF-7 cells (Ahola et al., 2002), expression that is critical for growth inhibition. This process was progestin-mediated and is involved in part in ERK inactivation (Ahola et al., 2002). A second phase of GPER-dependent signaling suggested that GPER promotes estrogen-mediated inhibition of oxidative stress-induced apoptosis by promoting Bcl-2 expression (Kanda and Watanabe, 2003b), promotes cell growth by stimulating of cyclin D expression (Kanda and Watanabe, 2004) and upregulates nerve growth factor production in macrophages through c-fos induction (Kanda and Watanabe, 2003a). Upregulation of c-fos by estrogen and phytoestrogens demonstrated also in breast cancer cells (Maggiolini 2004). It is noted that GPER not directly initiated the observed effects but is correlated with responsiveness to estrogen. Data confirmed by different reports that providing evidence on the capacity of binding of tritiated estrogen to membrane of SKBr3 and GPER-transfected HEK cells (Thomas et al., 2005). However GPER-transfected cell membrane treated with estrogen also activates GTP-binding proteins and the production of cAMP. The binding affinity and co-localization of a fluorescent estrogen to GPER both in GPER-transfected cells both in endogenously cells demonstrated that the binding affinity of GPER represented 10 fold higher value than that determined for ERα (Revankar et al., 2005). GPER that, for the large amount, was localized to intracellular membranes, predominantly in the endoplasmic reticulum, as demonstrated byexpression of a GFP-tagged GPER as well as antibody staining of endogenously expressed GPER. These evidences suggesting a novel site of action for GPER function. Both ER and GPER are capable of activating PI3K in response to estrogen treatment, the two receptors utilize distinct signaling pathways and respond differentially to tamoxifen (Revankar et al., 2005).Additional studies demonstrated, in fact, that GPER, but not ERα, was activated by tamoxifen to stimulate PI3K activity. Finally, although estrogen-mediated activation of PI3K could also be mediated by ERα, this mechanism did not involve EGFR transactivation, which was required for GPER.
Identification and characterization of GPER-selective ligands
In depth review of GPER ligand binding properties the ER antagonist/SERMs tamoxifen and ICI182/870 have been shown to act as GPER agonists (Filardo et al., 2000; Revankar et al., 2005). Bologa et al. screened a library of approximately 10,000 compounds for chemical similarity to
19
estrogen and the top 100 compound were tested for GPER activity (Bologa et al., 2006). A compound termed G-1 displayed an agonist activity against GPER. The peculiarity of this compound was that it resulted inactive against classical estrogen receptors and thus represented the first selective GPER ligand. Different studies revealed that G-1 was capable of eliciting calcium mobilization as well as PI3K activation in cells expressing GPER but not in cells expressing either ERα and ERβ (Bologa et al., 2006). Furthermore, G-1, like estrogen, mediated an inhibition of chemotaxis towards EGF/serum in both MCF-7, which express classical ERs and GPER, and SKBr3 cells, which express only GPER. Other groups, sub sequentially, have utilized G-1 to examine the role of GPER in multiple systems because in different cell contexts, the pathways utilized by estrogen may vary depending on the complement of receptors expressed (Sathya et al., 2015; Yan et al., 2015). Pang et al, confirmed a role of GPER in the control of meiotic arrest (Pang et al., 2008). The role of GPER was examined in urothelial cell proliferation, where estrogen have bimodal mechanism of action, at low concentration stimulates cell proliferation through the classical estrogen receptors while the response is reduced at high concentrations (Teng et al., 2008). Urothelial cells were also shown to express high levels of GPER, raising the question as to the specific roles of individual estrogen receptors in these cells. In these cells, in fact, G-1 stimulation inhibited cell proliferation, conversely to the classics effects of estrogen. The inhibitory effects of estrogen on cell proliferation correlate with GPER as demonstrated by overexpression of GPER inhibited, estrogen-induced cell proliferation. Furthermore, G-1 failed to induce c-fos, c-jun or cyclin D1 expression, and GPR30 overexpression abolished estrogen-induced c-fos, c-jun or cyclin D1 expression whereas GPR30 downregulation improved expression of the same genes. These results suggested that the classical estrogen receptor stimulating proliferation while GPER inhibit proliferation via downregulation of the AP-1 components c-fos and c-jun with decreases in cyclin D1 expression. The role of GPER in the mechanical hyperalgesia was examined through PKC activation proving that G-1 and not classical ER agonists activated PKC in neurons of dissociated dorsal root ganglia (Kuhn et al., 2008). Another study have investigated the contribution of membrane estrogen receptors in the estrogen-mediated modulation of dopamine transporters in nerve growth factor differentiated PC12 pheochromocytoma cells (Alyea et al., 2008). Depletion studies, using siRNA revealed that ERα depletion blocked estrogen-mediated efflux, GPER depletion increase efflux while ERβ depletion having no effects. G-1 administered alone had no effect on efflux but co-administration with estrogen resulted in substantial inhibition of the estrogen response. These data are symptomatic of an antagonist role of GPER compare to stimulatory effect of ERα. One of the major feedback targets for estrogen in the brain is the gonadotropin-releasing hormone (GnRH) neurons, which regulate gonadal function and fertility in mammals. G-1 does not
20
show any effect on the calcium dynamics of GnRH neurons, while estrogen and ERα selective agonists displayed activity (Romano et al., 2008). Experiments performed in vivo with G-1 to examine the effect on mammary and uterine tissue show that, estrogen, but not G-1, regulated expression of Wnt-4, Frizzled-2, IGF-1 or cycline E1 in these tissues(Otto et al., 2009). G-1 failed to induce ductal growth and endbud formation in the mammary gland. It was unclear from such study if appropriate conditions were employed or if GPER may exhibit altered kinetics or responses from those primarily evoked by classical estrogen receptors. Other two studies characterized GPER knockout mice but in one case revealed no obvious defects in reproductive organs (Otto et al., 2009) 22and in the other revealed alterations in glucose tolerance, bone growth, blood pressure and serum insulin-like growth factor-I levels (Martensson et al., 2009). In this last study, aged female GPER knockout mice were hyperglycemic with impaired glucose tolerance, associated with decreased insulin expression and release, both in vivo and in isolated pancreatic islets. Recent publications described the capacity of G-1 to induce vasodilatation with resulting decreases in blood pressure (Haas et al., 2009) as well as the treatment with this agonist ameliorate the effects of multiple sclerosis in an animal model of autoimmune encephalomyelitis (Wang et al., 2009). In both studies, G-1 activity was absent in GPER knockout mice, confirming the physiological activity of G-1 through GPER. In some cases for estrogen-mediated activity, GPER and ERs work in concert, as in estrogen induced thymic atrophy. This evidence was demonstrated using a GPER knockout mice and G-1 (Wang et al., 2008). Kamanga-Sollo et al in their study concluded that, whereas GPER mediates the estrogen-stimulated increase in IGF-I mRNA, ERα mediates the proliferative effect (Kamanga-Sollo et al., 2008). They examined the mechanism involved in the stimulation of IGF-I mRNA and muscle growth, using bovine muscle satellite cell culture. Of the therapeutic anti-estrogens, ICI182,780 (a selective estrogen receptor down-regulator, SERD) was first demonstrated to interact with GPER, but surprisingly, as opposed to its antagonistic action towards ERα/β, ICI182,780 acted as an agonist towards GPER (Filardo et al., 2000). Similarly, an active metabolite of tamoxifen, 4-hydroxytamoxifen (selective estrogen receptor modulator, SERM) acts as a GPER agonist (Vivacqua et al., 2006b), and recently raloxifene has also been demonstrated to activate GPER in cells deficient for ERα (Petrie et al., 2013). Different synthetic compounds known to have estrogenic effects have also been demonstrated to bind and/or activate GPER, including atrazine (Albanito et al., 2008a), bisphenol A (Chevalier et al., 2012; Dong et al., 2011; Sheng et al., 2013), daidzein (Kajta et al., 2013), zearalonone, nonphenol, kepone, p,p’-DDT, o,p’-DDE and 2,2′,5′,-PCB-4-OH (Thomas and Dong, 2006). Finally, also a number of phytoestrogens display agonist activity towards GPER, including genistein (Maggiolini et al., 2004; Vivacqua et al., 2006a),
21
quercetin (Maggiolini et al., 2004), equol (Rowlands et al., 2011), resveratrol (Dong et al., 2013), oleuropein, and hydroxytyrosol (Chimento et al., 2013b).
Transcriptional activations mediated by GPER
Rapid signaling events mediated by GPER can also lead to the activation of transcriptional machinery of estrogens with the ligand-dependent genomic model of ER activity. E2, in fact, through GPER, upregulates nerve growth factor inducing by c-fos expression via cAMP in macrophages (Kanda and Watanabe, 2003a; Kanda and Watanabe, 2003b). The same research group, however, demonstrated that E2 induces cyclin D2 and Bcl-2 expression via protein kinase A-mediated CREB phosphorylation in Keratinocytes (Kanda and Watanabe, 2004); E2, in fact, reduces hepatic injury after trauma-hemorrhage by upregulating Bcl-2 expression with a GPER and PKA-dependent pathway (Hsieh et al., 2007). Supplementary evidences of GPER-dependent transcriptional activation by E2 in ER-positive MCF-7 and ER-negative SKBr3 breast cancer cells were given by C-fos expression, determined using an early molecular sensor for estrogen activity (Maggiolini et al., 2004). The study proved that GPER signaling requires EGFR and happens through rapid ERK 1/2 phosphorylation in triggering the genomic response to estrogen particularly in tumor cells devoid of ERs. E2, the phytoestrogen genistein and the 4-hydroxylated metabolite of tamoxifen (OHT) induced the expression of c-fos through the GPER/EGFR/ERK signaling pathway and also induced proliferation of thyroid tumor cells lacking ER (ARO cells) or cells expressing a non-transcriptionally active variant of ERα (FRO and WRO cells) (Vivacqua et al., 2006a). The GPER pathway, hence, may represent a new window to examine the classical ER-mediated biological thyroid cell response. The discovery of G-1, represented a key experiment to study its activity (Bologa et al., 2006). Taking advantage of the lack of activity of G-1 on the classical ER and using ovarian cancer cells that express both ERα and GPER, was observed that G-1, like E2, up-regulated diverse estrogen-responsive genes including c-fos, pS2 and cyclins A, D1 and E; however, it wasn’t able to increase the ERα-target gene PR, which only responded to E2 treatment. The study was conducted using ER-negative and GPER-positive SKBr3 cells, where G-1 like E2 stimulated c-fos expression, but had no effect on PR expression (Albanito et al., 2008 b). Hence GPER, probably together with ERα, mediates the transcriptional activation of the other genes, while estrogen-activated PR expression occurs specifically through ERα. In addition, was demonstrated that exist an E2 and G-1 common pathway that mediates the genomic response.in ovarian cancer cells, in particular in the transcriptional activation of c-fos . Otherwise, knocking down GPER or ERα revealed a cross-talk between these estrogen receptors in the stimulation of cfos by G-1 and E2. From these data it is reasonable to argue that the evaluation of estrogenic activity of phyto- and
22
xenoestrogens should be extended to their potential ability to activate GPER signaling together with the classic effects exerted through the classical ER-mediated genomic response. A physiological role for GPER-mediated transcriptional responses through cross-talk with ERα was founded in mouse spermatogonia GC-1 cells, used to investigate the estrogen-mediated regulation of testicular function (Sirianni et al., 2008). The potential involvement of an estrogen-binding receptor, GPER, in estrogen signaling was investigated showing that E2 and G-1 activate the EGFR/ERK pathway causing the stimulation of c-fos and cyclin D1 expression as well as GC-1 cell growth. Conversely, using ICI182,780 or silencing GPER expression, the proliferative effects induced by E2 and G-1 were abrogated. The results obtained are consistent with a study in which demonstrated that E2, through the activity of a Gi protein, could induce rapid activation of ERK1/2 and PKA signaling pathways, which are involved in the proliferation of human germ cell tumors (Bouskine et al., 2008). Finally it is well known that tamoxifen can act as full agonist of GPER (Lappano et al., 2013; Vivacqua et al., 2006a) and GPER can mediate rapid E2-induced non-genomic signaling events. These events includes stimulation of adenylyl cyclase, mobilization of intracellular calcium (Ca2+) stores and activation of mitogen-activated protein kinase (MAPK) and phosphoinositide 3-kinase (PI3K) signaling pathways (Ariazi et al., 2010; Prossnitz and Barton, 2009). For all these reasons GPER exhibits prognostic utility in different cell lines.
Aim of the study
In the study we investigated the effect of G-1 an agonist of G Protein Coupled Estrogen Receptor (GPER) on ACC growth..
23
24
Cell culture and tissues
H295R cells were obtained from Dr W.E. Rainey (University of Michigan at Ann Arbor, USA) (Rainey et al., 1994). Cells were cultured cultured in Dulbecco’s modified Eagle’s medium/Ham’s F12 (DMEM/F12; 1:1; Eurobio, Les Ulis, France) supplemented with 1% ITS Liquid Media Supplement (100×; Sigma), 10% calf serum and antibiotics (Eurobio), at 37 °C in an atmosphere of humidified air containing 5% CO2. Cell monolayers were sub cultured onto 100 mm dishes for phosphatase activity and laddering assay (8 × 10⁶ cells/plate), 60 mm dishes for protein and RNA extraction (4 × 10⁶ cells/plate) and 24 well culture dishes for proliferation experiments (2 × 10⁵ cells/well) and grown for 2 days. Prior to experiments, cells were starved overnight in DMEM/F-12 medium without phenol red and containing antibiotics. Cells were treated with (±)-1-[(3aR*, 4S*, 9bS*)-4-(6-Bromo-1, 3-benzodioxol- 5-yl)-3a, 4, 5, 9b-tetrahydro-3H-cyclopenta[c]quinolin-8-yl]- ethanone (G-1) (1 μM) (Tocris Bioscience, Bristol, UK) in DMEM/F-12 containing FBS-DCC 2, 5% (fetal bovine serum dextran-coated charcoal-treated). Inhibitors PD98059 (PD) (10 μM) (Calbiochem, Merck KGaA, Darmstadt, Germany) was used 1 h prior to G-1. Adrenocortical tumors, removed at surgery, and normal adrenal cortex, macroscopically dissected from adrenal glands of kidney donors, were collected at the hospital-based Divisions of the University of Padua (Italy). Tissue samples were obtained with the approval of local ethics committees and consent from patients, in accordance with the Declaration of Helsinki guidelines as revised in 1983. Diagnosis of malignancy was performed according to the histopathologic criteria proposed by Weiss et al. (Weiss et al., 1989) and the modification proposed by Aubert et al. (Aubert et al., 2002). Clinical data of the six ACC patients included in this study are not showed. Patient C6 terminated mitotane treatment six months after beginning of therapy for severe gastrointestinal side effects. Patients C1 and C2 were treated with chemotherapy EAP protocol (etoposide, doxorubicin, and cisplatin) + mitotane.
RNA extraction, reverse transcription and real time PCR
TRizol RNA isolation system (Invitrogen, Carlsbad, CA, USA) was used to extract total RNA from H295R, SKBR3 and ACCs. Each RNA sample was treated with DNase I (Invitrogen), and purity and integrity of the RNA were confirmed spectroscopically and by gel electrophoresis before use. One microgram of total RNA was reverse transcribed in a final volume of 30 μl using the ImProm-II Reverse transcription system kit (Promega Italia S.r.l., Milano, Italia); cDNA was diluted 1:2 in nuclease-free water, aliquoted, and stored at − 20°C. The nucleotide sequences for GPER amplification were forward, 5′-CGCTCTTCCTGCAGGTCAA-3′, and reverse, 5′-ATGTAGCGGTCGAAGCTCATC-3′ ; the nucleotide sequences for GAPDH amplification were
25
forward, 5′-CCCACTCCTCCACCTTTGAC-3′, and reverse,
5′-TGTTGCTGTAGCCAAATTCGTT-3′. PCR reactions were performed in the iCycler iQ Detection System (Bio-Rad Laboratories S.r.l., Milano, Italia) using 0.1 μmol/L of each primer, in a total volume of 30 μl reaction mixture following the manufacturer’s recommendations. SYBR Green Universal PCR Master Mix (Bio-Rad) with the dissociation protocol was used for gene amplification; negative controls contained water instead of first-strand cDNA. Each sample was normalized to its GAPDH content. The relative gene expression levels were normalized to a calibrator (normal tissue for ACC tissues or SKBR3 for H295R cells). Final results were expressed as n-fold differences in gene expression relative to GAPDH and calibrator, calculated using the ΔΔCt method as previously shown (Sirianni et al., 2009).
Western Blot analysis
Fifty μg of protein was subjected to western blot analysis (Sirianni et al., 2007). Blots were incubated overnight at 4°C with antibodies against GPER, Cyclin E (CCNE), Cyclin B1 (CCNB1), phospho-Rb, Cytochrome c, Bax, Bcl-2, Parp1, pERK1/2-ERK2 (all from Santa Cruz Biotechnology, Santa Cruz CA, USA). Membranes were incubated with horseradish peroxidase (HRP)- conjugated secondary antibodies (Amersham Pharmacia Biotech, Piscataway, NJ) and immunoreactive bands were visualized with the ECL western blotting detection system (Amersham Pharmacia Biotech, Piscataway, NJ).To assure equal loading of proteins, membranes were stripped and incubated overnight with Glyceraldehyde 3-phosphate dehydrogenase (GAPDH) antibody (Santa Cruz Biotechnology).
Histopathological and Immunohistochemical analysis
Tumors were fixed in 4% neutral buffered formalin, embedded in paraffin, sectioned at 5 and stained with hematoxylin and eosin, as suggested by the manufacturer (Bio-Optica, Milan, Italy). Paraffin-embedded sections, 5 mm thick, were mounted on slides precoated with poly-lysine, and then they were deparaffinized and dehydrated (seven to eight serial sections). Immunohistochemical experiments were performed using mouse monoclonal Ki-67 primary antibody at 4°C over-night (Dako Italia Spa, Milano, Italy). Then, a biotinylated goat-anti-mouse IgG was applied for 1h at room temperature, to form the avidin biotin-horseradish peroxidase complex (Vector Laboratories, CA, USA). Immunoreactivity was visualized by using the diaminobenzi-dine chromogen (Vector Laboratories). Counterstaining was carried out with hematoxylin (Bio-Optica, Milano, Italy). The primary antibody was replaced by normal rabbit serum in negative control sections.
26
Cytochrome c detection
Cells were treated for 24 h, fractioned and processed for Cytochrome c detection as previously reported (Chimento et al., 2012). Briefly, cells were harvested by centrifugation at 2500 rpm for 10 min at 4°C. Pellets were resuspended in 50 μl of sucrose buffer (250 mM sucrose; 10 Mm Hepes; 10 mM KCl; 1.5 mM MgCl2; 1 mM EDTA; 1 mM EGTA) (all from Sigma-Aldrich, Milano, Italy) containing 20 μg/ml aprotinin, 20 μg/ml leupeptin, 1 mM PMSF and 0.05% digitonine (Sigma-Aldrich). Cells were incubated for 20 min at 4°C and then centrifuged at 13,000 rpm for 15 min at 4°C. Supernatants containing cytosolic protein fraction were transferred to new tubes and the resulting mitochondrial pellets were resuspended in 50 μl of lysis buffer (1% Triton X-100; 1 mM EDTA; 1 mM EGTA;
10 mM Tris-HCl, pH 7.4) (all from Sigma-Aldrich) containing 20 μg/ml aprotinin, 20 μg/ml leupeptin, 1 mM PMSF (Sigma-Aldrich) and then centrifuged at 13,000 rpm for 10 min at 4°C. Equal amounts of proteins were resolved by 11% SDS/polyacrylamide gel as indicated in the Western blot analysis paragraph.
Cell cycle analysis and evaluation of cell death
Subconfluent monolayers growing in 60 mm plates were depleted of serum for 24 h and treated for an additional 24 h with G-1. The cells were harvested by trypsinizationand resuspended with 0.5 ml of Propidium Iodide solution (PI) (100 μg/ml) (Sigma-Aldrich) after treatment with RNase A (20 μg/ml). The DNA content was measured using a FACScan flow cytometer (Becton Dickinson, Mountain View, CA, USA) and the data acquired using CellQuest software. Cell cycle profiles were determined using ModFit LT program. Subconfluent monolayers growing in 60 mm plates were depleted of serum for 24 h and treated for 24 and 48 h with G-1. Trypsinized cells were incubated with Ligation Buffer (10 mM Hepes (pH = 7.4), 150 mM NaCl, 5 mM KCl, 1 mM MgCl2 and 1.8 mM CaCl2) containing Annexin-V-FITC (1:5000) (Santa Cruz) and with Propidium Iodide. Twenty minutes post-incubation at room temperature (RT) protected from light, samples were examined in a FACSCalibur cytometer (Becton Dickinson, Milano, Italy). Results were analyzed using CellQuest program.
Caspases 9 and 3/7 Activity Assay
H295R cells after treatments were subjected to caspases 9 and 3/7 activity measurement with Caspase- Glo 9 and 3/7 assay kits (Promega) and modified protocol. Briefly, the proluminescent
27
substrate containing LEHD or DEVD sequences (sequences are in a single-letter amino acid code) are respectively cleaved by Caspases 9 and 3/7. After caspases cleavage, a substrate for luciferase (aminoluciferin) is released resulting in luciferase reaction luminescent signal production. Cells were trypsinized, harvested and then suspended in DMEM-F12 before being incubated with an equal volume of Caspase-Glo reagent (40 μl) at 37°C for 1 h. The luminescence of each sample was measured in a plate-reading luminometer (Gen5 2.01) with Synergy H1 Hybrid Reader..
TUNEL assay
Cells were grown on glass coverslips, treated for 24 h and then washed with PBS and fixed in 4% formaldehyde for 15 min at room temperature. Fixed cells were washed with PBS and then soaked for 20 min with 0.25% of Triton X-100 in PBS. After two washes in deionized water, they were stained using the Click-iT® TUNEL Alexa Fluor® Imaging Assay (Invitrogen) according to the manufacturer’s protocol. Co-staining with Hoechst33342 was performed to analyze the nuclear morphology of the cells after the treatment. Cell nuclei were observed and imaged under an inverted fluorescence microscope (200X magnification).
Determination of DNA fragmentation
To determine the occurrence of DNA fragmentation, total DNA was extracted from control and G-1 (1 μM) treated (48h) cells as previously described (Chimento et al., 2012). The attached and detached cells floating in the medium were collected by scraping and centrifuging (1500 rpm for 5 min at 4 _C). Pellets were washed three times with PBS and then resuspended in DNAladdering lysis buffer (10% NP40, 200 mMEDTA, 0.2 MTris–HCl pH 7.5). Lysates were centrifuged at 3000 rpm for 5 min at 4 °C. The recovered DNA was incubated with RNase A (final 5 lg/ll) in 1% SDS for 2 h at 56 °C. After addition of proteinase K (final 2.5 lg/ll) samples were incubated for an additional 3 h at 37 °C. DNA precipitation was performed using ethanol/ammonium acetate precipitation O/N at -80 °C. The following day samples were centrifuged at 12,000 rpm for 20 min at 4 _C and washed with 80% ice-cold ethanol. DNA pellets were resuspended in nuclease-free water. Equal amounts of DNA were analyzed by electrophoresis on a 2% agarose gel stained with ethidium bromide (Sigma–Aldrich).
Assessment of cell proliferation
[3H]Thymidine incorporation assay. H295R cell proliferation after G-1 treatment was directly evaluated as previously described (Sirianni et al., 2010). Cells were cultured in complete medium in 24 well plates (200,000 cells/well) for 24 h, then treated in serum-free medium for 48 h. Control
28
cells were treated with the same amount of vehicle alone (dimethylsulfoxide), which never exceeded the concentration of 0.01% (vol/vol). [3H]thymidine incorporation was evaluated after a 6 h incubation period with 1 lCi [3H]thymidine per well (Perkin–Elmer Life Sciences, Boston, MA, USA). Cells were washed once with 10% trichloroacetic acid, twice with 5% trichloroacetic acid, and lysed in 1 ml 0.1 N NaOH at 37 °C for 30 min. The total suspension was added to 5 ml optifluor fluid and radioactivity determined in a b-counter. Each experiment was performed in triplicate and results are expressed as percent (%) of basal.
The effect of G-1 on cell viability was measured using 3-[4,5-Dimethylthiaoly]-2,5-diphenyltetrazolium bromide (MTT) assay as previously described (Sirianni et al., 2012). Briefly, cells were treated for different times as indicated in figure legends. At the end of each time point fresh MTT (Sigma-Aldrich), re-suspended in PBS, was added to each well (final concentration 0.33 mg/ml). After 30 minutes incubation, cells were lysed with 1 ml of DMSO (Sigma-Aldrich). Each experiment was performed in triplicate and the optical density was measured at 570 nm in a spectrophotometer.
Gene silencing experiments
For the gene silencing experiments, cells were plated in 12 well plates (1 × 10⁵ cells/well) for proliferation experiments or in 6 well plates (2 × 10⁵ cells/well) for Western blot analysis; cells were transfected with control vector (shRNA) or shGPER in 2, 5% DCC-FBS medium using lipofectamine 2000 transfection reagent (Invitrogen) according to the manufacturer’s recommendations for a total of 72 h. For proliferation experiments cells were transfected for 24 h and then treated for 48 h before performing MTT assay.
Xenograft model
Four-week-old nu/nu − Forkhead box N1nu female mice were obtained from Charles River Laboratories Italia (Calco, Lecco, Italy). All animals were maintained in groups of five or less and quarantined for two weeks. Mice were kept on a 12 h/12 h light/dark regimen and allowed access to food and water ad libitum. H295R cells, 6 × 10⁶, suspended in 100 μl PBS (Dulbecco’s Phosphate Buffered Saline), were combined with 30 μl of Matrigel (4 mg/ml) (Becton Dickinson) and injected subcutaneously in the shoulder of each animal. Resulting tumors were measured at regular intervals using a caliper, and tumor volume was calculated as previously described (Seshadri et al., 2007), using the formula: V = 0.52 (L × W2), where L is the longest axis of the tumor and W is perpendicular to the long axis. Mice were treated 21 days after cell injection, when tumors had reached an average volume of about 200 mm3. Animals wererandomly assigned to be treated with
29
vehicle or G-1 (Tocris Bioscience) at a concentration of 2 mg/kg/daily. Drug tolerability was assessed in tumor-bearing mice in terms of: a) lethal toxicity, i.e. any death in treated mice occurring before any death in control mice; b) body weight loss percentage = 100 − [(body weight on day x/body weight on day 1) × 100], where x represents a day during the treatment period [66, 67]. Animals were sacrificed by cervical dislocation 42 days after cell injection. All animal procedures were approved by Local Ethics Committee for Animal Research.
Scoring system
The immunostained slides of tumor samples were evaluated by light microscopy using the Allred Score (Allred et al., 1998) which combines a proportion score and an intensity score. A proportion score was assigned representing the estimated proportion of positively stained tumor cells (0 = none; 1 = 1/100; 2 = 1/100 to < 1/10; 3 = 1/10 to < 1/3; 4 = 1/3 to 2/3; 5 = > 2/3). An intensity score was assigned by the average estimated intensity of staining in positive cells (0 = none; 1 = weak; 2 = moderate; 3 = strong). Proportion score and intensity score were added to obtain a total score that ranged from 0 to 8. A minimum of 100 cells were evaluated in each slide. Six to seven serial sections were scored in a blinded manner for each sample.
Data analysis and statistical methods
All experiments were performed at least three times. Data were expressed as mean values + standard error (SE), statistical significance between control (basal) and treated samples was
analyzed using GraphPad Prism 5.0 (GraphPad Software, Inc.; La Jolla, CA) software. Control and treated groups were compared using the analysis of variance (ANOVA) with Bonferroni or Dunn’s post hoc testing. A comparison of individual treatments was also performed, using Student’s t test. Significance was defined as p < 0.05.
30
31
H295R cell growth inhibited by G-1 treatment in vitro and in vivo
We examined GPER expression in human ACCs and in H295R cells by western blot analysis (Fig. 3. A) and real time RT-PCR (Fig. 3. B-C). Data demonstrated that GPER is expressed in normal adrenal, in human ACCs and in H295R cells at different levels. G-1 effects on cell viability and proliferation were tested using increasing concentrations (0.01-0.1-1µM) for different times (24-48-72 h) (Fig. 3. D-E). Among different doses tested only 1µM caused a time-dependent reduction in H295R cell growth. Doses higher than 1µM did not show any more pronounced effect (data not shown). Knocking down of GPER gene expression, using a specific shRNA, (shGPER) was assessed by western blot analysis and revealed a substantial decrease in protein content compared to the control shRNA (insert, Fig. 3. F). However, GPER silencing was able to only partially abrogate the inhibitory effects exerted by G-1 on H295R cell proliferation (Fig. 3. F).
32 Figure 3: G-1 treatment decreases H295R cell growth in vitro. (A), Western blot analysis of GPER was performed on 50 g of total proteins extracted from normal adrenal, ACCs and H295R cells. GAPDH was used as a loading control. (B-C), GPER mRNA expression in normal adrenal and ACCs (B), H295R and SKBR3 (positive control) cells (C) was analyzed by real time RT-PCR. Each sample was normalized to its GAPDH RNA content. Final results are expressed as n-fold differences of gene expression relative to calibrator. Data represent the mean+SE of values from at least three separate RNA samples; *, P<0.05, versus calibrator). (D-E), H295R cells were treated with G-1 (0.01-1M) for different times (24, 48 and 72 h). Cell proliferation was evaluated by [3H]Thymidine incorporation (D) and MTT (E) assays. Results were expressed as mean+SE of three independent experiments each performed in triplicate. Statistically significant differences are indicated (*, P<0.05 versus basal). (F) MTT assay was performed on H295R cells, which were previously transfected for 72 h in the presence of control vector (shRNA) or shGPER. Twenty-four hours after transfection cells were treated in 2.5 % DCC-FBS medium for 48 h with G-1 (1μM). Results were expressed as mean+SE of three independent experiments each performed in triplicate. (*p < 0.05 versus basal). The insert shows a Western blotting assay on H295R protein extracts evaluating the expression of GPER receptor in the presence of shRNA or of shGPER. GAPDH was used as a loading control.