2020-12-21T11:49:30Z
Acceptance in OA@INAF
The AGN fuelling/feedback cycle in nearby radio galaxies I. ALMA observations
and early results
Title
RUFFA , ILARIA; PRANDONI, ISABELLA; Laing, Robert A.; Paladino, Rosita;
PARMA, PAOLA; et al.
Authors
10.1093/mnras/stz255
DOI
http://hdl.handle.net/20.500.12386/29050
Handle
MONTHLY NOTICES OF THE ROYAL ASTRONOMICAL SOCIETY
Journal
484
Number
MNRAS 484, 4239–4259 (2019) doi:10.1093/mnras/stz255
Advance Access publication 2019 January 23
The AGN fuelling/feedback cycle in nearby radio galaxies
I. ALMA observations and early results
Ilaria Ruffa ,
1,2‹Isabella Prandoni ,
2Robert A. Laing,
3Rosita Paladino,
2Paola Parma,
2Hans de Ruiter,
2Arturo Mignano,
2Timothy A. Davis ,
4Martin Bureau,
5,6and Joshua Warren
51Dipartimento di Fisica e Astronomia, Universit`a degli Studi di Bologna, via P. Gobetti 93/2, I-40129 Bologna, Italy 2INAF - Istituto di Radioastronomia, via P. Gobetti 101, I-40129 Bologna, Italy
3Square Kilometre Array Organisation, Jodrell Bank Observatory, Lower Withington, Macclesfield, Cheshire SK11 9DL, UK 4School of Physics & Astronomy, Cardiff University, Queens Buildings, The Parade, Cardiff CF24 3AA, UK
5Sub-department of Astrophysics, Department of Physics, University of Oxford, Denys Wilkinson Building, Keble Road, Oxford OX1 3RH, UK 6Yonsei Frontier Lab and Department of Astronomy, Yonsei University, 50 Yonsei-ro, Seodaemun-gu, Seoul 03722, Republic of Korea
Accepted 2019 January 21. Received 2019 January 21; in original form 2018 August 9
ABSTRACT
This is the first paper of a series exploring the multifrequency properties of a sample of 11 nearby low-excitation radio galaxies (LERGs) in the southern sky. We are conducting an extensive study of different galaxy components (stars, warm and cold gas, radio jets) with the aim of improving our understanding of the active galactic nucleus (AGN) fuelling/feedback cycle in LERGs. We present ALMA band 612CO(2–1) and continuum observations of nine sources. Continuum emission from the radio cores was detected in all objects. Six sources also show mm emission from jets on kpc/sub-kpc scales. The jet structures are very similar at mm and cm wavelengths. We conclude that synchrotron emission associated with the radio jets dominates the continuum spectra up to 230 GHz. The 12CO(2–1) line was detected in emission in six out of nine objects, with molecular gas masses ranging from 2 × 10⁷ to 2 × 10¹⁰M
⊙. The CO detections show disc-like structures on scales from ≈0.2 to ≈10 kpc. In
one case (NGC 3100) the CO disc presents some asymmetries and is disrupted in the direction of the northern radio jet, indicating a possible jet/disc interaction. In IC 4296, CO is detected in absorption against the radio core as well as in emission. In four of the six galaxies with CO detections, the gas rotation axes are roughly parallel to the radio jets in projection; the remaining two cases show large misalignments. In those objects where optical imaging is available, dust and CO appear to be co-spatial.
Key words: galaxies: active – galaxies: elliptical and lenticular, cD – galaxies: ISM –
galaxies: jets – galaxies: nuclei.
1 I N T RO D U C T I O N
It is widely believed that feedback processes associated with active galactic nuclei (AGNs) can potentially play a fundamental role in shaping galaxies over cosmic time (e.g. Ciotti 2009; Ciotti, Ostriker & Proga 2010; Debuhr, Quataert & Ma 2012; King & Pounds2015; Harrison et al. 2018). AGN feedback can change the physical conditions of the surrounding interstellar medium (ISM), preventing gas cooling or even expelling the gas from the nuclear regions, thus impacting star formation processes and the subsequent evolution of the host galaxy (e.g. Combes2017;
⋆E-mail:[email protected]
Harrison 2017). Two main variants of feedback are commonly discussed: radiative and kinetic. The former is typically associated with a radiatively efficient (quasar-like) AGN; the latter with an energetic outflow or jet (e.g. Alexander & Hickox2012; Best & Heckman2012; Heckman & Best2014). Radio jets produce some of the clearest manifestations of AGN feedback such as cavities in the hot intracluster gas and jet-driven outflows in the ISM (see e.g. Fabian2012, for a review).
In the local Universe, radio galaxies (RGs), which by definition show strong kinetic (jet-induced) feedback, are typically hosted by the most massive early-type galaxies (ETGs). They can be divided into two classes according to their optical spectra (e.g. Heckman & Best2014). High-excitation radio galaxies (HERGs) have spectra showing strong, quasar/Seyfert-like emission lines,
Downloaded from ht tps: //academic. oup. com/ mnras/ art icle-abst ract /484/ 3/ 4239/ 5299582 by guest on 15 F ebruary 2019
accrete at ! 0.01 ˙MEdd (where ˙MEdd is the Eddington accretion rate1) and are radiatively efficient, thereby producing radiative as well as kinetic feedback. Low-excitation radio galaxies (LERGs) have spectra with weak, LINER-like emission lines, accrete at ≪ 0.01 ˙MEddand their feedback is almost entirely kinetic. It has been proposed that the dichotomy in accretion rate is a conse-quence of different trigger mechanisms and fuelling sources (e.g. Hardcastle, Evans & Croston2007). In this scenario, HERGs are fuelled by cold gas transported to their nuclei through merging or collisions with gas-rich galaxies, whereas LERGs are powered by direct accretion from the hot phase of the intergalactic medium (IGM). Allen et al. (2006) supported the hot accretion scenario, finding a correlation between the jet power of LERGs and the Bondi accretion rate (i.e. the rate of spherical accretion of the hot, X-ray emitting medium; Bondi1952). Russell et al. (2013) later reported a lower significance level for that correlation, however. More realistic models for LERGs, requiring chaotic accretion, were first proposed by Sanders (1981) and then elaborated by several authors, based on results from numerical simulations (see e.g. King & Pringle2007; Wada, Papadopoulos & Spaans2009; Nayakshin, Power & King
2012; Gaspari, Ruszkowski & Oh2013; Gaspari, Brighenti & Temi
2015; King & Pounds2015; Gaspari, Temi & Brighenti2017). In this mechanism (now referred to as chaotic cold accretion) the hot gas from the galaxy halo cools to temperatures lower than 103K and forms dense clouds of cold gas. Within a few Bondi radii2 chaotic inelastic collisions between the clouds are frequent enough to cancel their angular momentum, allowing them to accrete on to the super-massive black hole (SMBH).
The most compelling evidence that cold gas can play a role in fuelling LERGs is that it is frequently detected in these sources, with masses that are potentially capable of powering the jets by accretion (MH2∼ 107− 1010M⊙, e.g. Prandoni et al.2007,2010; Oca˜na Flaquer et al.2010). Hints of cold gas clouds falling towards active nuclei have recently been observed in some objects (e.g. Tremblay et al.2016; Maccagni et al.2018), providing support for this hypothesis. The presence of cold gas alone is not direct evidence of fuelling, however. For example, the cold gas in 3C 31 is found to be in ordered rotation and stable orbits (Okuda et al.2005): in cases like this the accretion rate may be relatively low. In other galaxies, the molecular gas appears to be outflowing or interacting with the radio jets, rather than infalling (e.g. Alatalo et al.2011; Combes et al.2013; Oosterloo et al.2017). The origin of the observed gas also remains unclear: it may cool from the hot gas phase or come from stellar mass loss, interactions or minor mergers.
Our project aims at exploring the multifrequency properties of a complete flux and volume-limited sample of 11 local LERGs in the southern sky. The purpose is to carry out an extensive study of the various galaxy components (stars, warm and cold gas, radio jets) to get a better understanding of the AGN fuelling/feedback cycle in LERGs, using the ATLAS3D galaxies as a radio-quiet control sample (Cappellari et al. 2011). In this framework we have acquired Atacama Pathfinder EXperiment (APEX)12CO(2–1) integrated spectra (Prandoni et al.2010, Laing et al. in preparation, hereafter Paper II), Very Large Telescope (VLT) Visible
Multi-1MEdd˙ = 4π G MSMBHmp
ε c σT , where G is the gravitational constant, MSMBHis
the mass of the central super-massive black hole (SMBH), mpis the mass
of the proton, ε is the accretion efficiency, c is the speed of light and σTis
the cross-section for Thomson scattering.
2The Bondi radius is given by rB=2 G MSMBH
c2s , where G is the gravitational
constant, MSMBHis the mass of the SMBH, and csis the speed of sound.
Object Spectrograph (VIMOS) integral-field-unit spectroscopy for the entire sample (Warren et al., in preparation) and Karl G. Jansky very large array (JVLA) high-resolution continuum observations at 10 GHz for five sources (Ruffa et al., in preparation). Archival
Hubble Space Telescope(HST) or ground-based optical/near-IR and VLA images are also used, when available.
In this paper, we present Atacama Large Millime-ter/Submillimeter Array (ALMA) Cycle 312CO(2–1) and 230 GHz continuum observations of nine objects. The paper is structured as follows. In Section 2, we present the sample, describing the selection criteria and available data. In Section 3, we describe the ALMA observations and data reduction; the analysis performed on the data products is detailed in Section 4. In Section 5, we present the results for individual galaxies. General properties of the sample are discussed in the context of earlier work in Section 6. We summarize our conclusions in Section 7. In appendix A, included as supplementary material in the online version of the paper, we present a brief description of the re-analysed archival VLA data and optical/IR imaging used in our analysis.
Throughout this work we assume a standard % cold dark matter (%CDM) cosmology with H0= 70 km s−1Mpc−1, &%= 0.7 and &M= 0.3. All of the velocities in this paper are given in the optical convention.
2 T H E S O U T H E R N R A D I O G A L A X Y S A M P L E We have defined a complete volume- and flux-limited sample of 11 RGs in the southern sky. This sample was selected from Ekers et al. (1989), who presented a complete sample of 91 RGs from the Parkes 2.7-GHz survey, all located in the declination range −17◦ < δ <−40◦, with a radio flux-density limit of 0.25 Jy at 2.7 GHz and an optical magnitude limit of mv= 17.0. From this sample, we selected those sources satisfying the following criteria:
(i) elliptical/S0 galaxy optical counterpart; (ii) host galaxy redshift z < 0.03.
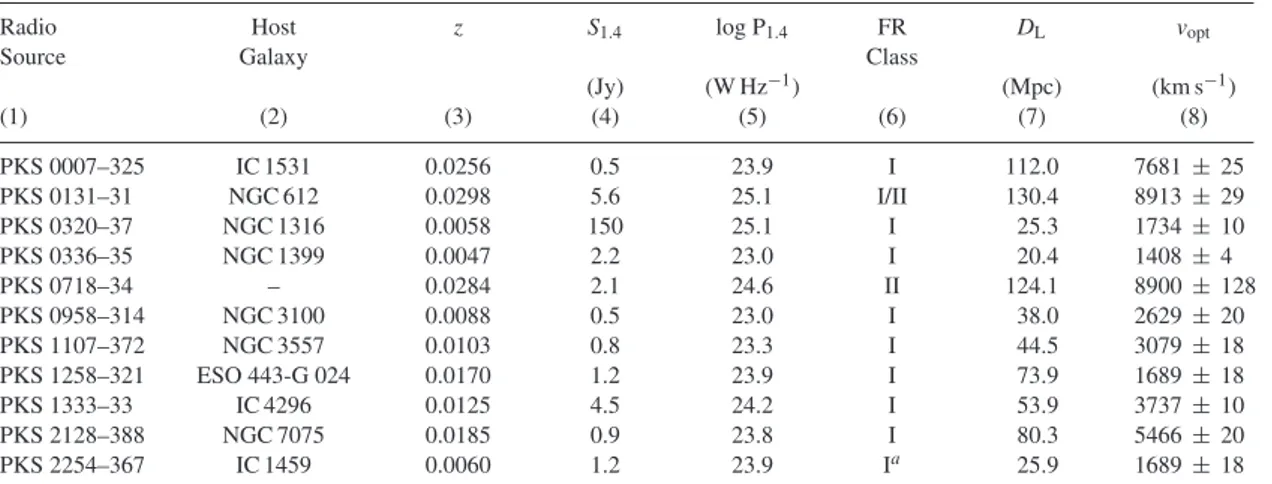
This resulted in a sample of 11 RGs, all with low or intermediate 1.4 GHz radio powers: P1.4GHz≤ 1025.5W Hz−1. The majority of the sources have FR I radio morphologies (Fanaroff & Riley1974); one is classified as intermediate between FR I and FR II and one as FR II. Based on the available optical spectroscopy (Tadhunter et al.1993; Smith et al.2000; Colless et al.2003; Collobert et al.2006; Jones et al.2009), all of the RGs in our southern sample have [OIII] line luminosities below the relation shown in fig. 2 of Best & Heckman (2012) and, as argued in that paper, can be securely classified as LERGs. The main characteristics of our southern sample galaxies are listed in Table1.
3 A L M A O B S E RVAT I O N S A N D DATA R E D U C T I O N
We used ALMA band 6 (≈230 GHz) to observe nine of the sample members. Two sources were excluded because the estimated integration times were unreasonably long. In NGC 1316 (PKS 0320–37, Fornax A) the CO is known to be distributed over an area much larger than the single-pointing field-of-view (FOV) of the ALMA main array at 230 GHz (Horellou et al.2001); a large mosaic and short-spacing information would be required to image it adequately. Based on measurements with APEX (Paper II), NGC 1399 (PKS 0336-35) appeared to be too faint for a reliable detection. Downloaded from ht tps: //academic. oup. com/ mnras/ art icle-abst ract /484/ 3/ 4239/ 5299582 by guest on 15 F ebruary 2019
ALMA observations of local radio galaxies
4241
Table 1. General properties of the southern radio galaxy sample.Radio Host z S1.4 log P1.4 FR DL vopt
Source Galaxy Class
(Jy) (W Hz−1) (Mpc) (km s−1) (1) (2) (3) (4) (5) (6) (7) (8) PKS 0007–325 IC 1531 0.0256 0.5 23.9 I 112.0 7681 ± 25 PKS 0131–31 NGC 612 0.0298 5.6 25.1 I/II 130.4 8913 ± 29 PKS 0320–37 NGC 1316 0.0058 150 25.1 I 25.3 1734 ± 10 PKS 0336–35 NGC 1399 0.0047 2.2 23.0 I 20.4 1408 ± 4 PKS 0718–34 – 0.0284 2.1 24.6 II 124.1 8900 ± 128 PKS 0958–314 NGC 3100 0.0088 0.5 23.0 I 38.0 2629 ± 20 PKS 1107–372 NGC 3557 0.0103 0.8 23.3 I 44.5 3079 ± 18 PKS 1258–321 ESO 443-G 024 0.0170 1.2 23.9 I 73.9 1689 ± 18 PKS 1333–33 IC 4296 0.0125 4.5 24.2 I 53.9 3737 ± 10 PKS 2128–388 NGC 7075 0.0185 0.9 23.8 I 80.3 5466 ± 20 PKS 2254–367 IC 1459 0.0060 1.2 23.9 Ia 25.9 1689 ± 18
Notes.Columns: (1) Name of the radio source; (2) Host galaxy name; (3) Galaxy redshift taken from the NASA/IPAC extragalactic database (NED); (4) Radio flux density at 1.4 GHz; this is the most accurate value given in NED and includes all the radio emission
associated with the source; (5) Logarithmic-scale radio power at 1.4 GHz derived from S1.4 and DL; (6) Fanaroff-Riley class
(Fanaroff & Riley1974); (7) Luminosity distance derived from the redshift given in column (3) and assuming the cosmology in
Section 1; (8) Best estimate of the optical stellar velocity from NED, given in the LSRK system, for comparison with CO velocities
in Table5.
aFR I structure on sub-arcsecond scale (see Tingay & Edwards2015).
Table 2. ALMA Cycle 3 observations.
Target Date νsky(vcen) Time MRS θmaj θmin PA Scale
(GHz) (km s−1) (min) (kpc, arcsec) (arcsec) (deg) (pc)
(1) (2) (3) (4) (5) (6) (7) (8) (9) IC 1531 2016-06-02 224.7774 (7702) 12.0 5.6, 10.9 0.7 0.6 87 360 NGC 612 2016-07-30 223.8426 (8974) 3.0 6.6, 11.0 0.3 0.3 −75 180 PKS 0718-34 2016-05-02 2016-05-03 223.8622 (8904) 32.2 6.3, 11.0 0.7 0.6 −80 400 NGC 3100 2016-03-22 228.6299 (2484) 28.5 1.9, 10.6 0.9 0.7 −87 160 NGC 3557 2016-06-03/04 228.2319 (2999) 22.5 2.0, 9.7 0.6 0.5 −70 130 ESO 443-G 024 2016-05-01 226.6839 (5089) 24.2 3.7, 10.8 0.7 0.6 −63 240 IC 4296 2016-06-04 2016-06-11 227.7110 (3705) 25.5 2.8, 10.8 0.6 0.6 −84 150 NGC 7075 2016-05-03 226.4196 (5483) 24.5 4.1, 10.8 0.6 0.6 −76 230 IC 1459 2016-04-11 229.1614 (1819) 11.4 1.3, 10.7 1.0 0.8 −71 120
Notes.Columns: (1) Target name; (2) Observation dates; (3)12CO(2–1) redshifted (sky) centre frequency estimated using the redshift
listed in column (3) of Table1; the corresponding velocity (vcen; LSRK system, optical convention) is reported in parentheses; (4)
Total integration time on-source; (5) Maximum recoverable scale in kiloparsec for the array configuration, and corresponding scale in arcseconds; (6) Major axis FWHM of the synthesized beam; (7) Minor axis FWHM of the synthesized beam; (8) Position angle of the synthesized beam; (9) Spatial scale corresponding to the major axis FWHM of the synthesized beam.
ALMA observations were taken during Cycle 3, between 2016 March and July (PI: I. Prandoni). Table2summarizes the details of the observations. The total time on-source ranged from 3 to 30 min. The spectral configuration consisted of four spectral windows: one centred on the redshifted frequency (νsky) of the12CO(J = 2–1) line (rest frequency 230.5380 GHz) and divided into 1920 1.129 MHz-wide channels; the other three, used to map the continuum emission, had 128 31.25-MHz-wide channels. Between 36 and 43, 12-m antennas were used, with 12-maxi12-mu12-m baseline lengths ranging from 460 m to 1.1 km. The maximum recoverable spatial scale (MRS), together with the major and minor axis full width half-maxima (FWHM) and position angle of the synthesized beam for each observation are reported in Table2. Titan and Pallas were used as primary flux calibrators; J1037–2934, J1107–4449, J2537– 5311, J0538–4405, and J1427–4206 were observed as secondary standards if no Solar system object was available.
We reduced the data using the Common Astronomy Software Application (CASA; McMullin et al.2007) package, version 4.7.2, calibrating each data set separately using customizedPYTHONdata reduction scripts.
3.1 Continuum imaging
The three continuum spectral windows and the line-free channels in the line spectral window were used to produce the continuum maps, using the CLEANtask in multifrequency synthesis (MFS)
mode with one Taylor series term (Rau & Cornwell2011). All the continuum maps were made using natural weighting in order to maximize the sensitivity, with the goal of imaging emission from the jets. Since the cores are detected at high signal-to-noise in all of the targets, multiple cycles of phase-only self-calibration were performed in all cases. Additional amplitude and phase
self-Downloaded from ht tps: //academic. oup. com/ mnras/ art icle-abst ract /484/ 3/ 4239/ 5299582 by guest on 15 F ebruary 2019
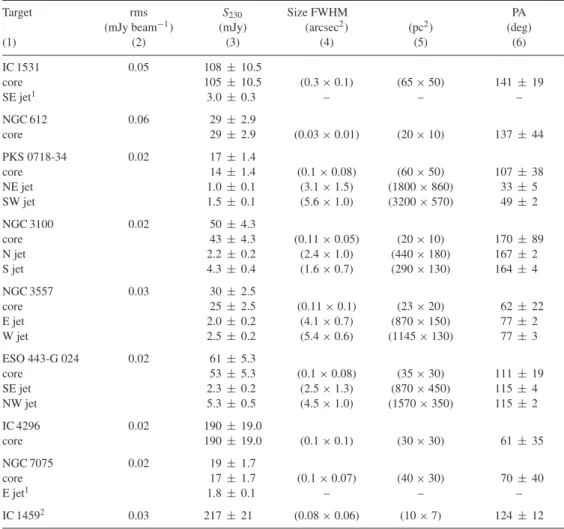
Table 3. Properties of the ALMA continuum images.
Target rms S230 Size FWHM PA
(mJy beam−1) (mJy) (arcsec2) (pc2) (deg)
(1) (2) (3) (4) (5) (6) IC 1531 0.05 108 ± 10.5 core 105 ± 10.5 (0.3 × 0.1) (65 × 50) 141 ± 19 SE jet1 3.0 ± 0.3 – – – NGC 612 0.06 29 ± 2.9 core 29 ± 2.9 (0.03 × 0.01) (20 × 10) 137 ± 44 PKS 0718-34 0.02 17 ± 1.4 core 14 ± 1.4 (0.1 × 0.08) (60 × 50) 107 ± 38 NE jet 1.0 ± 0.1 (3.1 × 1.5) (1800 × 860) 33 ± 5 SW jet 1.5 ± 0.1 (5.6 × 1.0) (3200 × 570) 49 ± 2 NGC 3100 0.02 50 ± 4.3 core 43 ± 4.3 (0.11 × 0.05) (20 × 10) 170 ± 89 N jet 2.2 ± 0.2 (2.4 × 1.0) (440 × 180) 167 ± 2 S jet 4.3 ± 0.4 (1.6 × 0.7) (290 × 130) 164 ± 4 NGC 3557 0.03 30 ± 2.5 core 25 ± 2.5 (0.11 × 0.1) (23 × 20) 62 ± 22 E jet 2.0 ± 0.2 (4.1 × 0.7) (870 × 150) 77 ± 2 W jet 2.5 ± 0.2 (5.4 × 0.6) (1145 × 130) 77 ± 3 ESO 443-G 024 0.02 61 ± 5.3 core 53 ± 5.3 (0.1 × 0.08) (35 × 30) 111 ± 19 SE jet 2.3 ± 0.2 (2.5 × 1.3) (870 × 450) 115 ± 4 NW jet 5.3 ± 0.5 (4.5 × 1.0) (1570 × 350) 115 ± 2 IC 4296 0.02 190 ± 19.0 core 190 ± 19.0 (0.1 × 0.1) (30 × 30) 61 ± 35 NGC 7075 0.02 19 ± 1.7 core 17 ± 1.7 (0.1 × 0.07) (40 × 30) 70 ± 40 E jet1 1.8 ± 0.1 – – – IC 14592 0.03 217 ± 21 (0.08 × 0.06) (10 × 7) 124 ± 12
Notes.Columns: (1) Target name; (2) 1σ rms noise level measured in emission-free regions of the cleaned continuum map; (3) 230 GHz continuum flux density; the total, core, and jet flux densities are quoted separately. The uncertainties
are estimated as!rms2+ (0.1 × S230)2, and the second term dominates in all cases. Errors on total flux densities
are obtained through error propagation. (4) Size (FWHM) deconvolved from the synthesized beam. The sizes were estimated by performing 2D Gaussian fits to identifiable continuum components; (5) Spatial extent of each component corresponding to the angular sizes in column (4); (6) Position angle of the corresponding component, defined north through east.
1Unresolved component.
2The FR I structure of this source is on milli-arcsecond (mas) scales (≤40 mas; Tingay & Edwards2015) and is
unresolved in our images.
calibration was performed for the brightest cores only. This allowed us to obtain root mean square (rms) noise levels ranging from 0.02 to 0.06 mJy beam−1 for synthesized beams of 0.3–1 arcsec FWHM.
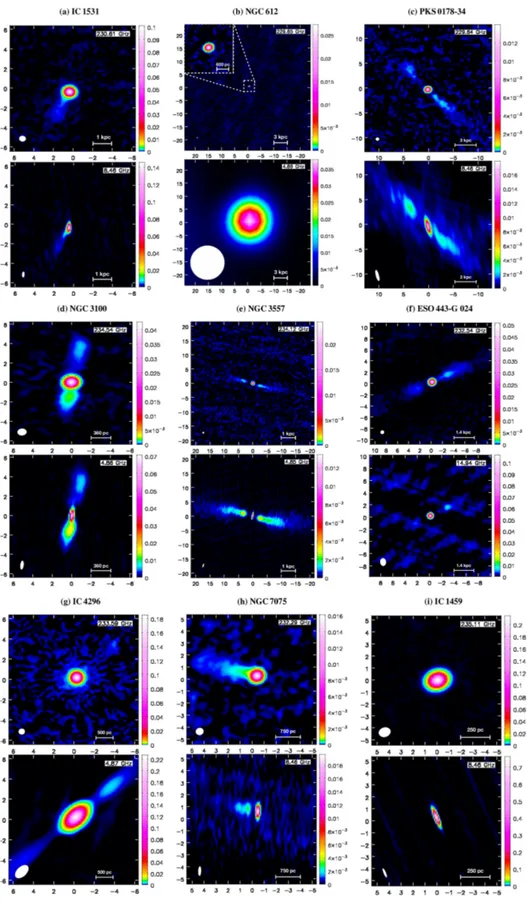
Two-dimensional Gaussian fits were performed within the re-gions covered by the continuum emission in order to estimate the spatial extent of each observed component. Table3summarizes the main properties of the millimetre continuum maps, which are shown in Fig. 1. For each object, the upper panel shows the ALMA millimetre continuum image, while the lower panel shows an archival VLA continuum map (at 4.9, 8.5, or 14.9 GHz), chosen to match as closely as possible the angular resolution of the corresponding ALMA image. All of the archival VLA data sets used in this work have been re-analysed using self-calibration and multiscaleCLEANas appropriate. Details of the VLA observations and data reduction are given in appendix A (provided as online only supplementary material), together with additional VLA images showing the large-scale radio structures of four sources. Although a
detailed comparison of the mm and cm continuum properties of our sources is not possible with the available archival cm-wave data, a brief analysis is provided in Sections 5 and 6.1.
3.2 Line imaging
After applying the continuum self-calibration, line emission was isolated in the visibility plane using the CASAtask UVCONTSUB
to form a continuum model from linear fits in frequency to line-free channels and to subtract it from the visibilities. We then produced a data cube of CO channel maps using theCLEANtask with natural weighting. The channel velocities were initially computed in the source frame with zero-points corresponding to the redshifted frequency of the CO(2–1) line (νsky, Table 2). The continuum-subtracted dirty cubes were cleaned in regions of line emission (identified interactively) to a threshold equal to 1.5 times the rms noise level, determined in line-free channels. Several channel widths (i.e. spectral bins) were tested to find a good compromise between
Downloaded from ht tps: //academic. oup. com/ mnras/ art icle-abst ract /484/ 3/ 4239/ 5299582 by guest on 15 F ebruary 2019
ALMA observations of local radio galaxies
4243
Figure 1. Naturally weighted ALMA band 6 (upper panels) and archival VLA (lower panels) continuum maps of each target. The reference frequency of
each observation is indicated in the top-right corner of the panel. The wedge on the right of each map shows the colour scale in Jy beam−1. Coordinates are
given as relative positions with respect to the image phase centre in arcseconds; east is to the left and north to the top. The synthesized beam and the scale bar
are shown in the bottom left and bottom right corner, respectively, of each panel. The properties of the ALMA continuum images are summarized in Table3.
Information about the archival radio images is provided in appendix A.
Downloaded from ht tps: //academic. oup. com/ mnras/ art icle-abst ract /484/ 3/ 4239/ 5299582 by guest on 15 F ebruary 2019
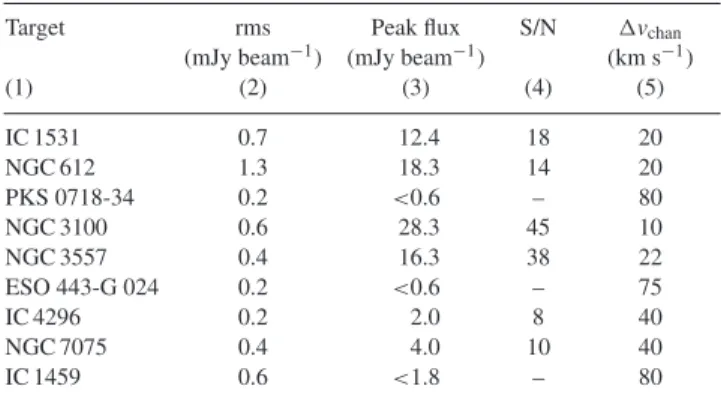
Table 4. Properties of the12CO(2–1) line images.
Target rms Peak flux S/N *vchan
(mJy beam−1) (mJy beam−1) (km s−1)
(1) (2) (3) (4) (5) IC 1531 0.7 12.4 18 20 NGC 612 1.3 18.3 14 20 PKS 0718-34 0.2 <0.6 – 80 NGC 3100 0.6 28.3 45 10 NGC 3557 0.4 16.3 38 22 ESO 443-G 024 0.2 <0.6 – 75 IC 4296 0.2 2.0 8 40 NGC 7075 0.4 4.0 10 40 IC 1459 0.6 <1.8 – 80
Notes.Columns: (1) Target name; (2) 1σ rms noise level measured in line-free channels at the channel width listed in column (5); (3) Peak flux density of the line emission; (4) Peak signal-to-noise ratio of the detection; (5) Final
channel width of the data cube (km s−1in the source frame).
signal-to-noise ratio (S/N) and resolution of the line profiles; the final channel widths range from 10 to 40 km s−1.
We clearly detect12CO(2–1) emission in six out of nine sources, with S/N ranging from 8 to 45. The cleaned CO data cubes are characterized by rms noise levels (determined in line-free channels) between 0.2 and 1.3 mJy beam−1.
Three targets (PKS 0718–34, ESO 443−G 024, and IC 1459) are undetected in CO. In these cases, line emission (and consequently line-free channels) could not be identified in the spectral window centred on the redshifted CO emission; the continuum was thus modelled using the three continuum spectral windows only. The continuum-subtracted dirty cubes for these targets were cleaned down to 1.5 times the expected rms noise level, with conservative spectral channel widths between 75 and 80 km s−1. The 1σ noise levels measured in the cleaned channel maps ranged from 0.2 to 0.6 mJy beam−1; in these cases 3σ upper limits are tabulated.
Table4summarizes the properties of the CO data cubes.
4 I M AG E C U B E A NA LY S I S 4.1 CO moment maps
Integrated intensity (moment 0), mean velocity (moment 1), and line velocity width (moment 2) maps of the detected lines were created from the cleaned, continuum-subtracted CO data cubes using the masked moment technique as described by Dame (2011, see also Bosma1981a,b; van der Kruit & Shostak1982; Rupen1999). In this technique, a copy of the cleaned data cube is first Gaussian-smoothed spatially (with a FWHM equal to that of the synthesized beam) and then Hanning-smoothed in velocity. A 3D mask is then defined by selecting all the pixels above a fixed flux-density threshold; this threshold is chosen so as to recover as much flux as possible while minimizing the noise. We used thresholds varying from 1.2 to 2σ , depending on the significance of the CO detection (higher threshold for noisier maps). The moment maps were then produced from the un-smoothed cubes using the masked regions only (e.g. Davis et al.2017). The resulting maps are shown in Figs2–
7, where the velocity zero-points are defined to be the intensity-weighted centroids of the observed CO emission. Based on their moment 0 and moment 1 maps, all detections show clear evidence of gas rotation, associated with discs or ring-like structures. There is evidence for asymmetries in the molecular gas distribution in a
number of cases, particularly NGC 3100 and IC 4296 (see Section 5 for more details).
For completeness, we show the moment 2 maps of all the targets detected in CO. It is worth noting however that they represent intrinsic velocity broadening only for those sources detected with a high S/N and/or whose CO emission is well resolved by our ALMA observations: this is certainly the case for NGC 612 and NGC 3100. Otherwise, the velocity dispersion (i.e. line-of-sight velocity width) is likely to be dominated by partially resolved velocity gradients within the host galaxy (beam smearing; e.g. Davis et al.2017).
The extent of the molecular gas was estimated by performing 2D Gaussian fits to the moment 0 maps within the regions covered by the CO emission. Table5summarizes the estimated sizes, which are given as deconvolved major and minor axis FWHM. The detected discs are typically confined to kpc or sub-kpc scales except for NGC 612, whose CO disc extends for at least 9.6 kpc along its major axis.
4.2 Line widths and profiles
The integrated spectral profiles of the six galaxies detected in CO(2–1) were extracted from the observed data cubes within boxes including all of the CO emission. The spectral profiles are shown in Figs2–7(panel d). The dimensions of the boxes used to extract the spectra are indicated in the figure captions.
All of the integrated spectral profiles exhibit the classic double-horned shape expected from a rotating disc. In one case (IC 4296) a strong absorption feature was also detected (Fig.6d). Line widths were measured as full-width at zero intensity (FWZI) as well as FWHM. The former was defined as the full velocity range covered by spectral channels (identified interactively in the channel map) with CO intensities ≥3σ . These channels are highlighted in grey in Figs2(d)–7(d) and we also tabulate the flux integrated over this range. FWHM was defined directly from the integrated spectra as the velocity difference between the two most distant channels from the line centre with intensities exceeding half of the line peak. We did not attempt to fit models to the spectra at this stage.
For non-detections, 3σ upper limits on the integrated flux densities were calculated from the relation (e.g. Koay et al.2016): +SCO*v (Jy beam−1km s−1) < 3σ *vFWHM
! *v *vFWHM
, (1)
where *v is the channel width of the data cube in which the rms noise level (σ ) is measured (see Table4) and *vFWHMis the expected line FWHM. We assumed the line FWHM measured from APEX CO(2–1) observations (Paper II; see also Table5). The factor √*v/*v
FWHMaccounts for the expected decrease in noise level with increasing bandwidth (Wrobel & Walker1999). Equation (1) is only valid if all of the molecular gas is concentrated within the synthesized beam (a few hundred parsec). If, more realistically, the molecular gas is distributed on larger scales, this assumption leads to a significant underestimation of the total flux limit. In this case, an estimate of the gas surface density upper limit is more meaningful (see Section 4.3).
The CO(2–1) line parameters are listed in Table 5. vCO, the intensity-weighted velocity centroids, is our best estimates of the systemic velocity of the line emission. The errors given for vCOare assumed to be equal to the channel widths of the corresponding integrated spectrum. The values of vCOare all consistent (within the combined errors) with the stellar velocities voptlisted in Table1.
Downloaded from ht tps: //academic. oup. com/ mnras/ art icle-abst ract /484/ 3/ 4239/ 5299582 by guest on 15 F ebruary 2019
ALMA observations of local radio galaxies
4245
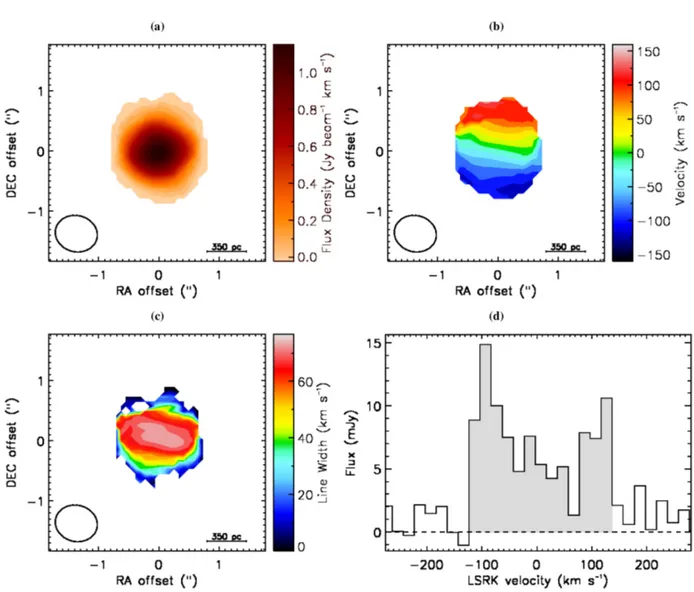
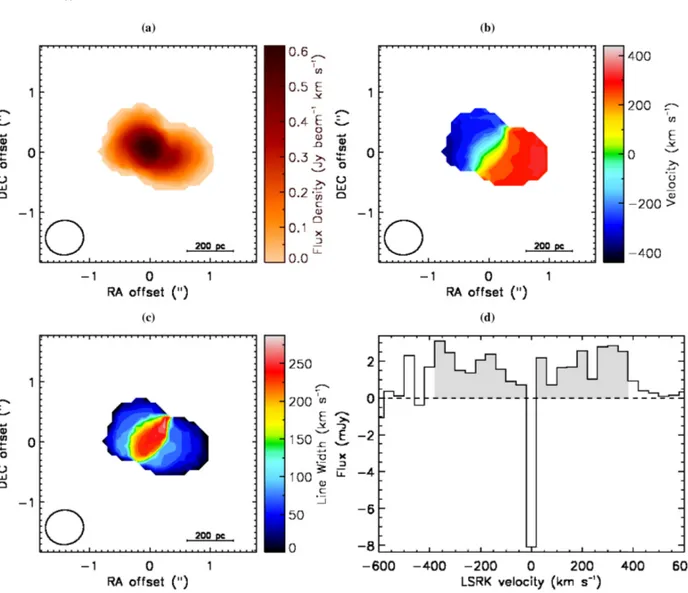
Figure 2. IC 1531 moment 0 (2a), moment 1 (2b) and moment 2 (2c) maps created with the masked moment technique described in Section 4 using a data
cube with a channel width of 20 km s−1. The synthesized beam is shown in the bottom left corner of each panel. The wedges to the right show the colour scale.
In each panel, east is to the left and north to the top. The integrated spectral profile in panel2d was extracted within a box of 1.6 × 1.6 arcsec2, including all the
CO emission. The spectral channels that are used to estimate the FWZI are highlighted in grey. The black dashed horizontal line indicates the zero flux level. In panels b–d, velocities are measured in the source frame and the zero-point corresponds to the intensity-weighted centroid of the CO emission, equivalent to
vCOin the LSRK frame (Table5).
4.3 Molecular gas masses
We adopted the following relation to estimate the total molecular gas masses, including contributions from heavy elements (Mmol; Bolatto, Wolfire & Leroy2013):
Mmol = 1.05 × 10 4 R21 ⎛ ⎜ ⎜ ⎝ XCO 2 × 1020 cm−2 K km s−1 ⎞ ⎟ ⎟ ⎠ (2) ×( 11 + z ) ( +SCO*ν Jy km s−1 ) ( DL Mpc )2 ,
where +SCO*v is the CO(2–1) flux integrated over velocity, R21is the CO(2–1) to CO(1–0) flux ratio, z is the galaxy redshift, DLis the luminosity distance, and XCOis the CO-to-H2conversion factor. XCO depends on the molecular gas conditions (e.g. excitation, dynamics, geometry) and the properties of the environment (e.g. metallicity; see Bolatto et al.2013) and is therefore likely to vary systematically
between different galaxy types. Little is known about XCOin nearby ETGs, because most studies are focused on gas-rich (and high gas metallicity) populations, typically late-type galaxies. Following Bolatto et al. (2013) and Tremblay et al. (2016), we assume the average Milky Way value of XCO= 2 × 1020cm−2K km s−1.
Another important uncertainty concerns the CO(2–1) to CO(1– 0) flux ratio, R21, which depends on optical depth and excitation conditions of the molecular gas (e.g. Braine & Combes1992). R21 can vary significantly between objects. Measurements of R21have been made for gas-rich disc galaxies (e.g. Sandstrom et al.2013) and for radio-quiet ETGs (e.g. Young et al.2011), but little is known about local radio-loud ETGs. The presence of a radio-loud AGN can significantly affect the conditions of the molecular gas in the surrounding regions (e.g. Oosterloo et al.2017), but it is not clear whether such phenomena are common.
To date, the best estimate of R21for RGs comes from the CO(2– 1) to CO(1–0) brightness temperature ratios measured by Oca˜na Flaquer et al. (2010). The mean ratio for 15 radio-loud ETGs ob-served in both CO transitions with the Institute de Radioastronomie
Downloaded from ht tps: //academic. oup. com/ mnras/ art icle-abst ract /484/ 3/ 4239/ 5299582 by guest on 15 F ebruary 2019
Ta bl e 5. Main 12CO(2–1) line inte grated parameters. Ta rg et L in e FW H M L in e FW Z I + SCO * v Mmol vCO Size FWHM +CO (km s − 1)( km s − 1)( Jy km s − 1)( M⊙ )( km s − 1)( kp c 2)( M⊙ pc − 2) (1) (2) (3) (4) (5) (6) (7) (8) IC 1531 260 260 2.0 ± 0.2 (1.1 ± 0.1) × 10 8 7686 ± 20 (0.25 ± 0.05) × (0.22 ± 0.06) 3.8 × 10 3 NGC 612 760 840 273 ± 27 (2.0 ± 0.2) × 10 10 8924 ± 20 (9.6 ± 0.3) × (1.2 ± 0.05) 1.0 × 10 4 PKS 0718-34 334 a 480 a < 0.1 < 6.7 × 10 6 –– < 2.7 × 10 2 NGC 3100 340 440 18 ± 1.8 (1.2 ± 0.1) × 10 8 2600 ± 10 (1.6 ± 0.3) × (0.5 ± 0.08) 9.1 × 10 2 NGC 3557 440 484 7.0 ± 0.7 (6.2 ± 0.6) × 10 7 3089 ± 22 (0.3 ± 0.02) × (0.2 ± 0.01) 3.7 × 10 3 ESO 443-G 024 786 a 1000 a < 0.1 < 3.5 × 10 6 –– < 3.9 × 10 2 IC 4296 b 760 760 1.6 ± 0.1 (2.0 ± 0.2) × 10 7 3760 ± 40 (0.2 ± 0.02) × (0.04 ± 0.02) 3.0 × 10 3 NGC 7075 560 600 1.0 ± 0.1 (2.9 ± 0.2) × 10 7 5510 ± 40 < 0.2 3.3 × 10 3 IC 1459 492 a 640 a < 0.4 < 1.0 × 10 6 –– < 7.6 × 10 2 Notes. Columns: (1) Tar get name; (2) Line FWHM defined directly from the inte grated spectra as the velocity dif ference between the tw o most distant channels from the line centre with intensities ≥ 50% of the line pe ak ;( 3) Fu ll ve lo ci ty ra ng e co ve re d by sp ec tr al ch an ne ls (i de nt ifi ed in te ra ct iv el y in th e ch an ne lma p) w ith C O in te ns iti es ≥ 3σ (FWZI, gre y shaded re gion in Figs 2 – 7 ); (4) Inte grated CO flux density measured inte grating numerically ov er all the channels in the range defined by the FWZI. Upper limits of the undetected sources are in units of Jy beam − 1km s − 1.T he velocity ranges in columns (2)–(4) are measured in the so ur ce fr am e; (5 ) M ol ec ul ar ga s ma ss de ri ve d us in g eq ua tio n (2 ); (6 ) C O sy st em ic ve lo ci ty in th e L SR K fr am e (o pt ic al co nv en tio n) ,d et er m in ed nu m er ic ally as the intensity-weighted centroid of the mean velocity map; (7) Size (FWHM, decon volv ed from the beam) of the CO emission; (8) C O surf ace density ov er the area co ve red by the CO emission. The surf ace densitie so f th e un de te ct eds ou rc es w er e es tim at edo ve r th e beam area. aThe line FWHM and FWZI of undetected sources are those estimated from APEX spectra (P aper II). bT he mo le cu la r ga s ma ss of IC 42 96 is m ea su re d co ns id er in g C O em is si on on ly .I f th e ch an ne ls of th e ab so rp tio n fe at ur e ar e in cl ud ed (a nd in te gr at ed as C O emission), we obtain + SCO * v = (1.9 ± 0.1) Jy km s − 1, Mmol = (2.3 ± 0.8) × 10 7M ⊙ .
Millimetrique (IRAM) 30 m telescope is 2.32. This is the same as the flux density ratio provided that the CO emission is unresolved, since the ratios of the square of wavelength and the beam size cancel precisely (e.g. David et al.2014; Temi et al.2018). We therefore take R21
= 2.32. We plan to test this assumption directly through observations of different CO transitions for our sample.
The estimated molecular masses range from 2.0 × 10⁷to 2.0 × 10¹⁰M
⊙; upper limits for the non-detections are in the range 1.0– 6.7 × 10⁶
M⊙. As discussed in the previous section, these upper limits will be underestimated if the CO emission is resolved. We have therefore also measured values or limits for the CO surface density (+CO). For the detected sources, values averaged over the area covered by the CO emission range from 900 to few thousands of M⊙ pc−2. Limits for the undetected sources are typically a few hundred M⊙ pc−2. Values and limits for Mmoland +COare listed in Table5.
5 R E S U LT S : I N D I V I D UA L S O U R C E S IC 1531 (PKS 0007-325)
IC 1531 is a barred lenticular galaxy (SB0) in a low-density environment (O’Sullivan, Sanderson & Ponman2007), with a FR I radio structure (Van Velzen et al.2012).
We detect a bright nuclear source in the continuum (Fig. 1a, top panel). Emission from the south-east jet is also detected. The archival VLA image of IC 1531 at 8.4 GHz (Fig.1a, bottom panel) shows similar core-jet structure. No counter-jet to the north-west is detected at either frequency.
A disc of molecular gas is detected at 18σ significance (Fig.2a). The disc is barely resolved in our observation, with a deconvolved major axis FWHM of 250 pc (Table5). The estimated molecular gas mass is 1.1 × 10⁸
M⊙. The mean velocity map in Fig.2b shows a rotation pattern with an (s-shaped) distortion in the zero-velocity contour (i.e. the kinematic centre), possibly suggesting the presence of a warp in the molecular gas disc. This needs to be confirmed with higher resolution observations. The integrated spectral profile in Fig.2(d) exhibits the double-horned shape of a rotating disc. The line width (Fig.2c) is likely to be dominated by beam smearing. NGC 612 (PKS 0131-36)
NGC 612 is a peculiar lenticular galaxy viewed close to edge-on, characterized by an extensive and strongly warped dust distribution in the equatorial plane and by a massive stellar disc (Westerlund & Stokes1966; Fasano, Falomo & Scarpa1996; Duah Asabere et al.
2016). The presence of a stellar disc is exceptional for extended RGs, at least in the luminosity range 1022−1025(e.g. Ekers et al.
1978; V´eron-Cetty & V´eron2001; Emonts et al.2008; Morganti et al.2011; Mao et al.2015, and references therein). NGC 612 is one of the few examples known to date. A 140 kpc-wide disc of atomic hydrogen (HI) with MHI= 1.8 × 10⁹M⊙ was detected by Emonts et al. (2008). A faint outer bridge of HI connects NGC 612 with the barred galaxy NGC 619, roughly 400 kpc away. This suggests that a past interaction between the two galaxies (or a minor merger event) may have channelled large amounts of gas and dust into NGC 612, also triggering the associated radio source. The large-scale radio map at 4.9 GHz published by Morganti, Killeen & Tadhunter (1993, a re-imaged version is presented in fig. A1) shows a weak core, a bright hot-spot at the outer edge of the more prominent eastern lobe, and a more diffuse western lobe with a total radio power P1.4 GHz= 1.5 × 1025W Hz−1. Downloaded from ht tps: //academic. oup. com/ mnras/ art icle-abst ract /484/ 3/ 4239/ 5299582 by guest on 15 F ebruary 2019
ALMA observations of local radio galaxies
4247
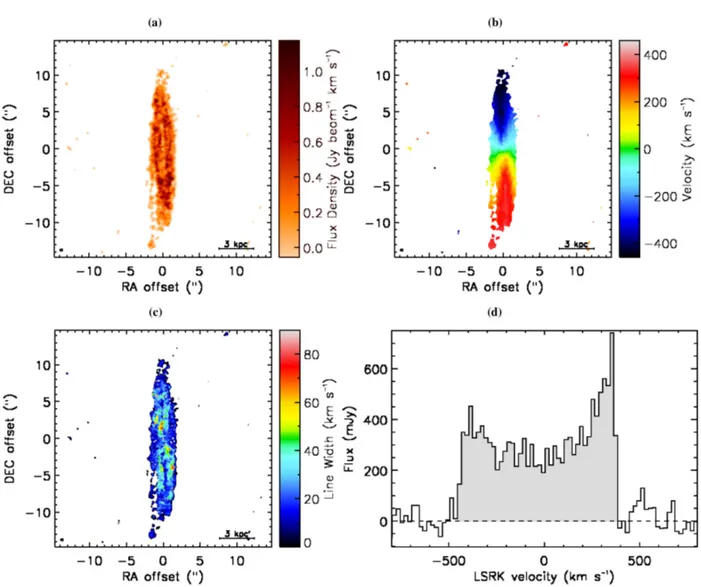
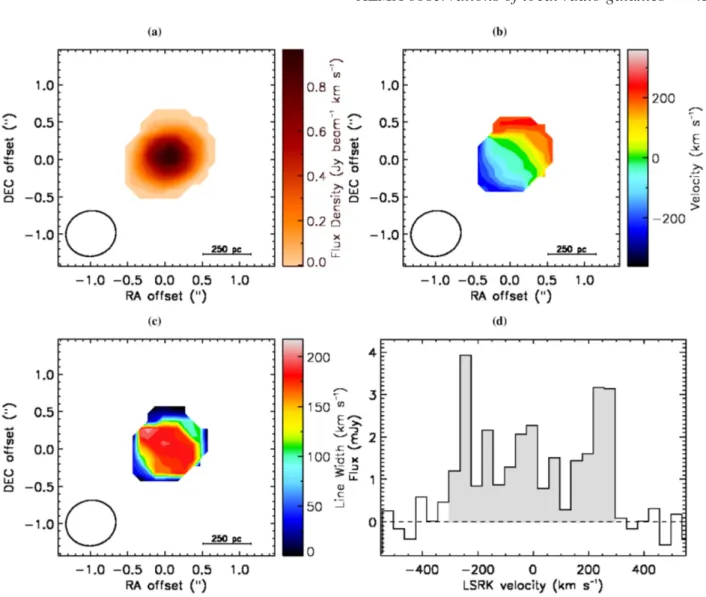
Figure 3. NGC 612 moment maps and spectral profile as in Fig.2, created using a data cube with a channel width of 20 km s−1. The integrated CO spectral
profile was extracted within a box of 4 × 20 arcsec2.
We detect a marginally resolved nuclear source in the continuum map of NGC 612 (Fig.1b, upper panel). Continuum emission from the central region of the extended radio source is also visible in an archival VLA 4.9 GHz map (Fig.1b, bottom panel) but at much lower resolution. We detect a large-scale disc of molecular gas with an extent of 9.6 kpc along the major axis, by far the largest in our sample. The molecular gas distribution appears clumpy (Fig.3a). The estimated molecular gas mass is 2.0 × 10¹⁰
M⊙, larger by about two orders of magnitude than that of any other sample member (see Table5). The mean velocity map (Fig.3b) shows a regularly rotating disc with some asymmetries at its extreme edges, where the major axis of the velocity field changes orientation, suggesting the presence of a warp on large scales. A well-defined double-horned shape is visible in the integrated spectrum (Fig.3d), with some asymmetries reflecting those in the gas distribution, the higher peak in the integrated spectrum at positive velocities being associated with the larger extent of the disc to the south. The moment 2 map (Fig.3c) shows the ‘x-shaped’ morphology characteristic of a rotating disc (e.g. Davis et al.2017). The velocity dispersion varies from ∼10 to ∼100 km s−1, but the regions characterized by line widths >40 km s−1are highly localized, while the bulk of the disc has a dispersion <30 km s−1.
PKS 0718-34
PKS 0718-34 is a radio source hosted by an elliptical galaxy in a poor environment (Govoni et al.2000a). The 4.9 GHz VLA map published by Ekers et al. (1989) shows a poorly resolved, double-sided source.
A barely resolved nuclear source is detected in the 230 GHz continuum (Fig.1c, upper panel). Faint, double-sided emission from the jets is also detected, extending up to 3.2 kpc to the south-west and 1.8 kpc to the north-east of the nucleus. The 230 GHz continuum emission traces the radio structure observed at lower resolution in the archival 8.5 GHz VLA map (Fig.1c, lower panel).
This object is undetected in CO, with estimated Mmol < 6.7 × 10⁶
M⊙ on the assumption of a point source, or +CO< 2.7 × 10²
M⊙ pc2(Table5). NGC 3100 (PKS 0958-314)
NGC 3100 is classified as a late-type S0 galaxy: it is characterized by a patchy dust distribution, a bright nuclear component, a nuclear bulge, and weak asymmetric arm-like structures in the outer disc (Sandage & Brucato1979; Laurikainen et al.2006). It is located
Downloaded from ht tps: //academic. oup. com/ mnras/ art icle-abst ract /484/ 3/ 4239/ 5299582 by guest on 15 F ebruary 2019
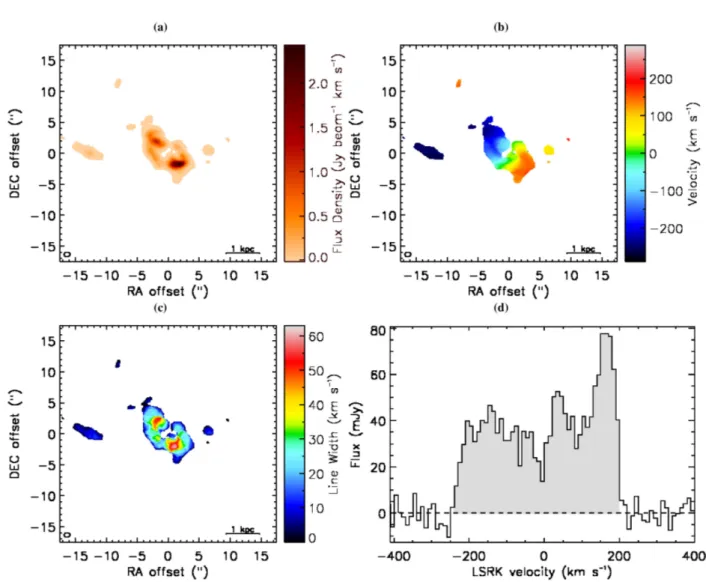
Figure 4. NGC 3100 moment maps and spectral profile as in Fig.2created using a data cube with a channel width of 10 km s−1. The integrated CO spectral
profile was extracted from the data cube within a 8.6 × 10 arcsec2box.
in a poor group and forms a pair with NGC 3095 (De Vaucouleurs
1976).
The 230 GHz continuum map of NGC 3100 (Fig.1d, upper panel) shows a bright nuclear source. Extended emission from a two-sided jet is also detected. The northern and southern jets extend more than 400 pc and ≈300 pc from the nucleus, respectively. The continuum structures visible at 230 GHz and at 4.9 GHz match very well (Fig.1d).
We detect well-resolved CO(2–1) emission with a FWHM of 1.6 kpc along the major axis. The moment 0 image (Fig. 4a) shows an incomplete ring with a gap to the north-west of the nucleus and flux density enhancements to the south-west and north-east. The mean velocity map (Fig. 4b) shows that the ring is rotating, but with some distortions in the rotation pattern. The iso-velocity contours are tilted and the major axis position angle clearly changes moving from the egde to the centre of the ring, indicating the possible presence of a warp and/or non-circular motions. The velocity dispersion map (Fig. 4c) shows CO line broadening on either side of the central hole, roughly consistent in position with the flux density enhancements. As discussed in Section 6.3, these features are suggestive of a physical interaction between the jets and the molecular gas disc. The integrated CO
spectrum (Fig. 4d) exhibits the double-horned shape typical of a rotating disc, but with asymmetries reflecting those in the gas distribution.
Fig.4(a) also shows the presence of two structures at ≈1.3 kpc west and ≈2.3 kpc east from the outer edges of the central ring, detected at 7.5σ and 14σ , respectively. Including these two structures, we estimate a total molecular gas mass of Mmol = 1.2 × 10⁸
M⊙. The velocity field in Fig.4(b) shows that the western and eastern regions have redshifted and blueshifted velocities, respectively, consistent with the nearest edges of the central ring but with different position angles. This leads us to speculate that they may trace the presence of a larger, warped molecular gas disc whose outer emission is below the detection threshold of our observations. Alternatively, we may be seeing molecular clumps in a disc of atomic gas.
NGC 3557 (PKS 1107-372)
NGC 3557 is a regular elliptical galaxy in a group (Govoni et al.
2000a). Its optical properties have been studied extensively (Col-bert, Mulchaey & Zabludoff 2001; Capetti & Balmaverde 2005;
Downloaded from ht tps: //academic. oup. com/ mnras/ art icle-abst ract /484/ 3/ 4239/ 5299582 by guest on 15 F ebruary 2019
ALMA observations of local radio galaxies
4249
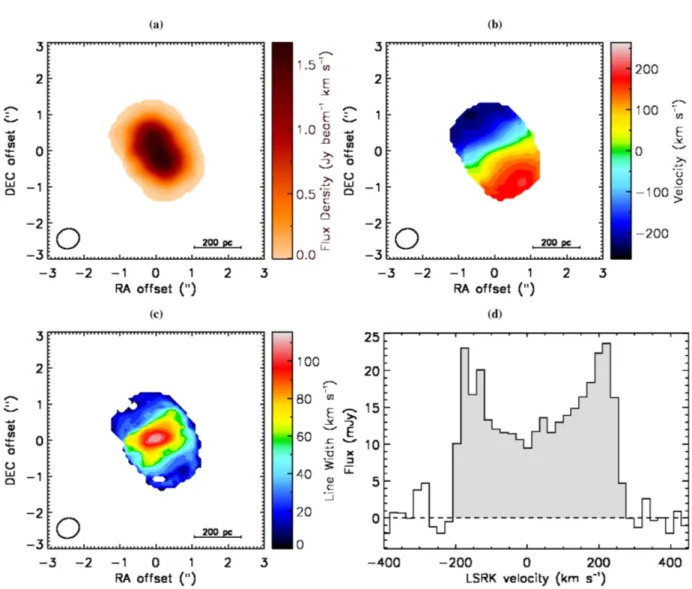
Figure 5. NGC 3557 moment maps and spectral profile as in Fig.2, created using a data cube with a channel width of 22 km s−1. The integrated CO spectral
profile was extracted within a 3.0 × 3.0 arcsec2box.
Lauer et al. 2005; Balmaverde & Capetti 2006). In particular, high-resolution HST observations clearly show the presence of a prominent dust ring in the central regions (e.g. Lauer et al.2005, see also the right-hand panel of Fig.11).
NGC 3557 is the host galaxy of the double-sided radio source PKS 1107-372, which was first imaged by Birkinshaw & Davies (1985).
The continuum map of NGC 3557 (Fig.1e, upper panel) shows emission from the core and a two-sided jet. The eastern and western jets extend ≈900 pc and ≈1.2 kpc, respectively, from the nucleus. The continuum emission detected at 230 GHz traces the inner part of the radio structure visible on larger scales in the archival 4.9 GHz VLA map (Fig.1e, lower panel).
We detect a CO disc (Fig. 5a) with Mmol = 6.2 × 10⁷ M⊙. The disc is barely resolved in our observations, which have a beamwidth of 0.6 arcsec FWHM. The deconvolved major axis of the disc is ≈300 pc FWHM. The mean velocity map (Fig. 5b) shows that the gas is rotating regularly. This is also consistent with the symmetric double-horned shape of the integrated spectral profile (Fig.5d). The velocity dispersion (Fig.5c) decreases from ≈100 km s−1in the centre to ≈20 km s−1at the edges of the disc and shows a boxy profile; both features are likely to be due to beam smearing.
ESO 443-G 024 (PKS 1258-321)
ESO 443-G 024 is an elliptical galaxy in the cluster Abell 3537 (Govoni et al.2000a). It is the host galaxy of the FR I radio source PKS 1258-321, characterized by a double-sided radio morphology (fig. A2, upper panel).
The source is detected in the continuum, showing a bright nuclear component and also faint extended emission from a two-sided jet (Fig.1f, top panel). The and north-west jets extend ≈900 pc and ≈1.6 kpc, respectively, from the nucleus. The extended emission detected at 230 GHz matches that observed at lower sensitivity in the archival 15 GHz VLA map (Fig.1f, bottom panel).
ESO 443-G 024 is undetected in CO with estimated Mmol < 3.5 × 10⁶
M⊙ assuming a point source, or +CO<3.9 × 10²M⊙ pc2 (Table5).
IC 4296 (PKS 1333-33)
IC 4296 is an elliptical galaxy and is the brightest member of the group HCG 22 (Huchra & Geller 1982). HST observations reveal a prominent nuclear dust disc (Lauer et al.2005). IC 4296 hosts the FR I radio source PKS 1333-33. The core is marginally resolved on scales of few parsecs (Venturi et al.2000). A
large-Downloaded from ht tps: //academic. oup. com/ mnras/ art icle-abst ract /484/ 3/ 4239/ 5299582 by guest on 15 F ebruary 2019
I. Ruffa et al.
Figure 6. IC 4296 moment maps and spectral profile as in Fig.2created using a data cube with a channel width of 40 km s−1. The integrated CO spectral
profile was extracted within a 2 × 1.5 arcsec2box.
scale, symmetric, double-sided jet extends up to 5 arcmin (77 kpc) from the nucleus, connecting with the outer lobes at 30 arcmin (Killeen, Bicknell & Ekers1986; Burke-Spolaor et al.2009). The inner jet structure of IC 4296 is discussed further in appendix A (fig. A3).
A bright continuum nuclear source is detected at 230 GHz (Fig.1g, upper panel), with a major axis FWHM of 30 pc. The inner jets are undetected at 230 GHz, but faint (7σ ) emission is detected at a distance of about 950 pc north-west of the nucleus, coincident with the brighter knot of the north-west jet visible in the archival 4.9 GHz VLA map (Fig.1g, bottom panel).
We detect CO(2–1) emission with an estimated molecular gas mass of 2.0 × 10⁷
M⊙. The CO integrated intensity map (Fig.6a) shows a disc with a somewhat asymmetric morphology. The velocity field (Fig.6b) shows an s-shaped zero-velocity contour, suggesting the presence of a warp in the disc, although better resolution observations are necessary to confirm this hypothesis. The moment 2 map (Fig.6c) is likely to be dominated by beam smearing. The integrated spectral profile (Fig.6d) reveals the presence of a strong absorption feature that is discussed in more detail in Section 6.2.
Boizelle et al. (2017) presented Cycle 2 ALMA observations of IC 4296 in the same CO transition. They reported a 5σ CO(2–1) detection with an integrated flux of 0.76 Jy km s−1, about a factor of
two lower than that measured in this work. However, their CO(2–1) observation is a factor of two noisier than that presented in this paper (for the same channel width) and this may have caused them to miss some of the emission. We also note that they used different R21 and XCOvalues. Their mass estimate is therefore a factor of three lower than ours. The integrated spectral profile of IC 4296 presented in Boizelle et al. (2017) is qualitatively similar to ours, with a line width of ≈± 480 km s−1.
NGC 7075 (PKS 2128-388)
NGC 7075 is an elliptical galaxy with an optically unresolved component in the core (Govoni et al.2000b). It is the host galaxy of the FR I radio source PKS 2128-388: a low-resolution 4.9 GHz VLA map of NGC 7075 showing its large-scale radio structure is presented in appendix A (fig. A2, lower panel).
A nuclear source is detected in our 230 GHz continuum map (Fig.1h, upper panel), with a major axis FWHM of 40 pc. Faint emission from the eastern jet is also detected, extending to ≈1.9 kpc from the nucleus; the western (counter-) jet is undetected. The eastern jet is also visible in the archival 8.5 GHz VLA map (Fig.1h, lower panel). Downloaded from ht tps: //academic. oup. com/ mnras/ art icle-abst ract /484/ 3/ 4239/ 5299582 by guest on 15 F ebruary 2019
ALMA observations of local radio galaxies
4251
Figure 7. NGC 7075 moment maps and spectral profile as in Fig.2, created using a data cube with a channel width of 40 km s−1. The integrated CO spectral
profile was extracted within a box of 1 × 1 arcsec2.
We detect a barely resolved CO(2–1) disc (Fig. 7a), with an estimated molecular gas mass of 2.9 × 10⁷
M⊙. The mean velocity map (Fig.7b) shows regular gas rotation. The line width (Fig.7c) is likely to be dominated by beam-smeared rotation.
IC 1459 (PKS 2254-367)
IC 1459 is an elliptical galaxy in a poor group of spiral galaxies. A faint dust lane is detected in the HST image of IC 1459, mostly visible towards the galaxy outskirts; its morphology is interpreted as a transitional stage between a patchy chaotic structure and a nuclear ring (Sparks et al.1985; Lauer et al.2005). IC 1459 also contains one of the most prominent counter-rotating cores observed in an elliptical galaxy (Verdoes Kleijn et al.2000; Cappellari et al.2002; Ricci, Steiner & Menezes2015), probably the result of a major merger between gas-rich spiral galaxies (e.g. Hernquist & Barnes
1991).
IC 1459 is the host galaxy of the radio source PKS 2254–367, which was classified by Tingay, Edwards & Tzioumis (2003) as a compact (arcsec-scale), GHz-peaked radio source (GPS) in a high-density environment.
We detect continuum emission from a bright nuclear source (Fig. 1i, upper panel) with an estimated major axis FWHM of 10 pc. This marginally resolved continuum emission matches that visible in the archival 8.5 GHz VLA map (Fig.1i, lower panel). The angular resolution (0.9 arcmin) of our observations does not allow us to resolve the pc-scale double-sided radio source detected with Very-Long Baseline Interferometry by Tingay & Edwards (2015).
Surprisingly, IC 1459 is undetected in CO with ALMA, with estimated Mmol<1.0 × 10⁶M⊙ assuming a point source, or +CO <7.6 × 10²M⊙ pc2(Table5).
6 D I S C U S S I O N
6.1 Origin of the 230 GHz continuum emission
The continuum emission at 230 GHz is morphologically very similar to the emission observed at frequencies between 4.9 and 15 GHz in the archival VLA images (Fig. 1). It is likely to be dominated by radio synchrotron emission from the core and jet structures. There is no evidence of thermal emission associated with extended dust or CO, although we cannot rule out the possibility
Downloaded from ht tps: //academic. oup. com/ mnras/ art icle-abst ract /484/ 3/ 4239/ 5299582 by guest on 15 F ebruary 2019
I. Ruffa et al.
Figure 8. Spectral index maps of NGC 3100 (left-hand panel) and NGC 3557 (right-hand panel), obtained from our ALMA 230 GHz and archival VLA 4.9 GHz maps. The wedge on the right of each map indicates the colour scale. Coordinates are reported as relative position with respect to the image phase centre, in arcsec; east is to the left and north to the top.
of some contribution to the unresolved core emission from this mechanism.
For two sources, NGC 3100 and NGC 3557, the available VLA archive data at 4.9 GHz (Fig. 1d and 1e, bottom panels) are sufficiently well matched to the ALMA data in resolution (see Tables2and A1) and uv coverage to enable us to derive spectral-index maps. The ALMA and VLA input maps were first re-imaged using theCASA CLEANtask in MFS mode (nterms = 1) with the
same uv ranges and natural weighting. The maps were restored with the same synthesized beam and spectral index maps were then produced using theCASAtaskIMMATH. The results are shown in
Fig.8. As expected, the radio cores show flat spectra (−0.2 < α < 0.2, for S ∝ να), while the jet spectra are steeper (α ≈ −0.7). This is consistent with synchrotron emission, partially optically thick (self-absorbed) in the core and optically thin in the jets. The jet spectral indices are slightly steeper than those typically seen between 1.4 and 4.9 GHz in FR I jets (α ≈ −0.6; Laing & Bridle2013), but there is no sign of abrupt high-frequency steepening due to synchrotron or inverse Compton losses.
We also estimated the spectral indices of the radio cores of all the sources using the core flux densities determined from the ALMA 230 GHz and archival VLA continuum maps shown in Fig.1. The VLA maps were chosen to match the ALMA images as closely as possible in resolution (Table A1), but we note that for NGC 612 the only available VLA map has much lower resolution. The estimated core spectral indices are listed in Table6. All of the spectra are flat, as expected for partially optically thick synchrotron emission from the inner jets, except for NGC 7075 and IC 1459. The latter has a sub-arcsecond FR I radio structure which is unresolved in our observations (Tingay & Edwards2015), so we expect the emission to be dominated by an optically thin component.
6.2 CO absorption
6.2.1 Search for absorption
We searched for absorption features in all the galaxies detected in CO by extracting integrated spectra in small boxes around
Table 6. Core spectral index.
Target αcore νVLA
(GHz) (1) (2) (3) IC 1531 0.17 8.5 NGC 612 0.10 4.9 PKS 0718-34 0.12 8.5 NGC 3100 − 0.2 4.9 NGC 3557 0.2 4.9 ESO 443-G 024 0.25 14.9 IC 4296 0.05 4.9 NGC 7075 − 0.43 8.5 IC 1459 − 0.40 8.5
Notes.Columns: (1) Target name; (2) Core spectral index between 230 GHz
and νVLA; (3) Frequency of the VLA radio map.
the bright nuclear continuum sources. The integrated spectrum of IC 4296 shows a deep and narrow absorption feature (already clear in Fig.6d). This is discussed in detail below (Section 6.2.2). No significant absorption features were found in any of the other sources. In particular, we do not detect CO absorption against the nucleus of NGC 612, where Morganti et al. (2001) found absorption in HI.
6.2.2 Absorption in IC 4296
In order to investigate the absorption feature in IC 4296 in more detail, we re-imaged the visibility data into a cube with a channel width of 3 km s−1(i.e. approximately twice the raw channel width). We then extracted the CO spectrum from a 0.4 × 0.4 arcsec2 (≈100 × 100 pc) box, centred on the 230 GHz core continuum emission. The resulting spectrum is shown in Fig. 9. The ab-sorption peak is at 3720 ± 3 km s−1, consistent within the errors with the most accurate determination of the optical systemic velocity (3737 ± 10 km s−1; see Table1). The maximum absorp-tion depth measured from this spectrum is −20.2 mJy and the FWHM is ≈9 km s−1, resulting in an integrated absorption flux of
Downloaded from ht tps: //academic. oup. com/ mnras/ art icle-abst ract /484/ 3/ 4239/ 5299582 by guest on 15 F ebruary 2019
ALMA observations of local radio galaxies
4253
Figure 9. CO spectral profile of IC 4296 extracted within a 0.4 × 0.4 arcsec2
box around the core. The spectrum has a channel width of 3 km s−1. The
black dashed horizontal line indicates the zero flux level. Some unresolved CO emission is visible above the zero flux level. The line absorption feature
has a FWHM of 9 km s−1, with an absorption peak of ≈−20.2 mJy.
≈0.14 Jy km s−1. Morganti et al. (2001) presented a 3σ upper limit of τ < 0.041 for the optical depth of the HI absorption in IC 4296. Following Morganti et al. (2001), we measured the peak optical depth, τ , using the core flux density derived from the continuum image (Table3): the resulting optical depth is τ ≈ 0.12. If we assume an HI spin temperature of 100 K (e.g. Morganti et al.2001), a CO excitation temperature of 10 K (e.g. Heyer et al.2009), and an HI to H2column density ratio of ∼10−2, as estimated from HI and CO absorption in the radio emitting LINER PKS B1718–649 (Maccagni et al.2014,2018), we estimate an HI optical depth of τ ≈ 1.2 × 10⁻⁴, well below the upper limit calculated by Morganti et al. (2001).
The spectral profile in Fig. 9 also exhibits fainter absorption features on either side of the peak (broader at blueshifted velocities). Similar structures are visible in the integrated spectrum of IC 4296 presented by Boizelle et al. (2017) with comparable channel width and extraction region. The observed asymmetric features may be a signature of the disc warping inferred on larger scales from the velocity field of CO in emission (see Section 5). Alternatively, they may be interpreted as an indication of the presence of non-circular motions in the central 100 pc of the CO disc. Higher resolution observations are needed to differentiate between these two scenarios.
6.3 Jets and molecular gas
Fig.10shows the mean CO(2–1) velocity maps for the detected galaxies with the corresponding 230 GHz continuum contours superimposed. For those sources in which emission from the resolved jets was not detected at 230 GHz, we added dashed arrows to indicate the jet axes as determined from archival VLA data. The position angles of the jet axis and the CO disc major axis are listed in Table7. Following De Koff et al. (2000) and De Ruiter et al. (2002), we estimated the alignment angles as |*P A| = |P ACO− P Ajet| ranged in 0–90◦. This is a measure of the relative orientation of CO discs and jets, at least in projection. A more comprehensive analysis would require 3D modelling of both the radio jets and the molecular gas disc, in order to estimate their inclinations with respect to the plane of the sky and hence their true (mis-)alignments.
It is clear from our analysis that the jet/disc relative orien-tations span a wide range. In four of the six detected galaxies (67 ± 33 per cent) we measure large misalignements (|*PA| ≥ 60◦), meaning that the gas discs are roughly orthogonal to the jets in projection (i.e. the rotation axes of the gas and the jets appear almost parallel); two sources (33 ± 24 per cent), however, show smaller alignment angles (|*PA| < 60◦), suggesting a significant misalignment between the jet and the disc rotation axes, at least in projection. These results are statistically consistent with earlier findings based on the analysis of jets and dust lanes, although a larger sample is obviously needed to draw significant conclusions about the form of the misalignment distribution, for example bimodality (see Section 6.5 for a more detailed discussion).
NGC 3100 is a special case. While the jet and disc rotation axes appear almost aligned in projection, there are indications of a possible interaction between the gas and the jets. The ring-like CO distribution shows a clear discontinuity to the north of the nucleus, in the direction of the northern jet (Fig.10c). Enhancements of both line brightness and width are visible adjacent to the jet (Figs4a and c), as well as distortions in the rotation pattern (Fig.4b), that may hint at warps and/or non-circular motions. We also note that the VIMOS IFU [OIII]λ5007 map of NGC 3100 shows clear equivalent width broadening (by a factor of 2) at the positions of the peaks of both radio jets (Warren et al., in preparation), reinforcing the case for a jet/gas interaction.
6.4 Comparison of CO and dust distributions
It is expected that dust obscuration and line emission from cold molecular gas will trace the same component of the ISM of ETGs. The association between the presence of nuclear dust discs and double-horned CO line profiles is well established (Prandoni et al.
2007,2010; Young et al. 2011) and the imaging observations of Alatalo et al. (2013) demonstrated a clear morphological corre-spondence. This co-spatiality seems also to be confirmed for the four of our CO detected sources for which optical imaging is available (see sections A2 and A3 for details), although higher resolution observations would be needed in some cases to draw strong conclusions.
Fig.11shows archival HST images of IC 4296 and NGC 3557, with the CO moment 0 contours overlaid. In both cases, the dust and molecular gas are clearly co-spatial. The distorted CO morphology of IC 4296 accurately follows that of the dust (Fig.11a), supporting the hypothesis of a warp as suggested by the CO velocity field (Fig.6b). The CO distribution in NGC 3557 appears to be settled in a regular disc, whereas the dust shows a well-defined ring-like structure (Fig.11b). In this case, it is possible that the CO distribution would be resolved into a ring by observations with FWHM" 0.3 arcsec
Fig. 12(a) shows the CO moment 0 contours of NGC 3100 overlaid on a B−I dust absorption map (see section A3, for details). The CO ring of NGC 3100 appears to be co-spatial with a nuclear dust ring, while the outer structure detected to the east seems to trace a diffuse dust patch on larger scales. Additional dust is visible beyond the detected CO emission, possibly indicating the presence of a larger CO distribution which could be below the detection threshold or beyond the FOV of our observations (≈26 arcmin).
Fig.12(b) shows the CO moment 0 contours of NGC 612 overlaid on an archival photographic B band optical image; a B−I dust absorption map is shown in the bottom right corner (see section A3 for details). The CO disc seems to be located slightly eastward of and skewed with respect to the dominant dust lane visible in
Downloaded from ht tps: //academic. oup. com/ mnras/ art icle-abst ract /484/ 3/ 4239/ 5299582 by guest on 15 F ebruary 2019
I. Ruffa et al.
Figure 10. Mean velocity (moment 1) maps of the six12CO(2–1) detections, with 230 GHz continuum contours superimposed. Contours are drawn at 1, 3,
9... times the 3σ rms noise level. The wedge on the right shows the colour scale of the CO velocity maps. The beam and the physical scale bars are drawn in the bottom left and bottom right corner of each panel, respectively. Black dashed arrows indicating the jet axes are also included in panels b and e. The alignment angle between the jet axis and the CO disc, |*PA|, is given in the top-right corner of each panel (see the text for details).
the B band image. The B−I colour map shows the presence of an inner dust lane, which may be co-spatial with the CO disc, although there is still a slight apparent difference in position angle on the sky. Given the low spatial resolution of the B-band image and the absence of absolute astrometry for the colour map, the connection between CO and dust in this object is not clear: higher resolution optical observations are needed.
6.5 Dust and molecular gas in radio galaxies
There is evidence that RGs contain significantly more cold gas and dust than radio-quiet ETGs. A correlation between dust mass
and radio power was found by De Ruiter et al. (2002). LERGs with 1.4 GHz radio luminosities P1.4! 1022W Hz−1also contain significantly larger masses of cold molecular gas than radio-weak or radio-silent ETGs (Paper II), but the dependence of dust and gas mass on P1.4does not appear to extend to lower radio luminosities (Paper II; Baldi et al.2015).
De Koff et al. (2000) found the dust properties of RGs to be strongly correlated with FR classification, in the sense that FR II sources have larger masses of dust in chaotic distributions, whereas FR Is tend to have smaller masses of dust in kpc-scale discs. Similar results were subsequently found by De Ruiter et al. (2002). Given the almost one-to-one correspondence between FR class and
emission-Downloaded from ht tps: //academic. oup. com/ mnras/ art icle-abst ract /484/ 3/ 4239/ 5299582 by guest on 15 F ebruary 2019
ALMA observations of local radio galaxies
4255
Table 7. Alignment between jets and CO discs.Target PACO PAjet |*PA|
(deg) (deg) (deg)
(1) (2) (3) (4) IC 1531 176 158 18 NGC 612 4 97 87 NGC 3100 48 165 63 NGC 3557 31 77 46 IC 4296 57 131 74 NGC 7075 130 68 62
Notes.Columns: (1) Target name; (2) Kinematic position angle of the CO disc measured counterclockwise from north to the approaching side of the velocity field; (3) Position angle of the jet axis (from north through east)
derived from the 230 GHz continuum images (see also Table3) or the
archival radio images presented in this work; (4) Alignment angles between
the jet axes and CO discs, |*PA| = |PACO− PAjet| ranged in 0–90◦.
line classification for those particular samples (FR I = LERG; FR II = HERG), the results are equally consistent with a fundamental relation between optical spectral type (or accretion rate) and dust mass, in the sense that HERGs have more dust than LERGs. This has a natural explanation in the framework of recent ideas on the fuelling of the two classes of RG (Heckman & Best2014) and therefore seems physically more plausible than a direct relation between dust mass and FR class.
Our results are consistent with the observation that dust in LERGs is most usually in disc-like distributions (De Koff et al.2000; De Ruiter et al.2002). To a good first approximation, our CO detections show disc or ring-like structures on kpc or sub-kpc scales (NGC 612 is significantly larger). It therefore seems likely that the gas and dust are mostly in regular orbits, with NGC 612, NGC 3100, and IC 4296 perhaps still being in the process of settling, as in the episodic model described by Lauer et al. (2005).
Kotanyi & Ekers (1979) first suggested that dust discs and jets tend to be orthogonal and De Koff et al. (2000) supported this result, albeit with clear outliers (see also Van Dokkum & Franx
1995). De Ruiter et al. (2002) found that 79 per cent of the RGs in
their sample (mostly LERGs) have alignment angles ≥60◦, further supporting this scenario. Schmitt et al. (2002) found less tendency to orthogonality and Verdoes Kleijn & de Zeeuw (2005) suggested that orthogonality is restricted to galaxies with irregular dust lanes (as opposed to more regular, disc-like distributions like those found in our sample). Although the small sample size does not allow us to draw strong conclusions, our results on CO/jet (mis-)alignments are statistically consistent with previous studies: in four cases the gas discs are roughly orthogonal to the jets in projection; in two objects there are gross misalignments.
Simulations of jet formation by black holes accreting at ≪0.01 ˙
MEdd, as inferred for LERGs, confirm that jets are launched along the spin axes of the holes and their inner accretion discs, primarily powered by electromagnetic energy extraction (Blandford & Znajek
1977; McKinney, Tchekhovskoy & Blandford2012). For a simple axisymmetric system we might expect a common rotation axis for the black hole, inner accretion disc, and kpc-scale molecular disc. In this case, the jets and molecular discs should be accurately orthogonal. This is clearly not always true, and models in which the jets can be misaligned with respect to the rotation axis of either the accretion disc or the larger scale dust/molecular gas disc have therefore been discussed extensively in the literature (e.g. Kinney et al.2000; Schmitt et al.2001,2002; Verdoes Kleijn & de Zeeuw
2005; Gallimore et al.2006; King & Nixon2018).
One possibility is that the molecular gas results from a minor merger or interaction and has not yet settled into a principal plane of the host galaxy potential (e.g. Lauer et al.2005; Shabala et al.
2012; Van de Voort et al.2015, 2018). In this case, there is no reason for the angular momentum vector of the gas to be aligned with that of the central black hole. Schmitt et al. (2002) and Verdoes Kleijn & de Zeeuw (2005) argue against this idea on the grounds that regular dust discs appear to rotate around the short axes of oblate-triaxial gravitational potentials and have therefore settled. Both of the galaxies in our sample with extreme disc-jet misalignments (IC 1531 and NGC 3557) show regular disc rotation (at the resolution of our ALMA observations) and the gas and stars rotate together (see below). At least in these two cases, the gas is likely to have settled. Gas in younger (and therefore smaller)
Figure 11. Archival HST images of (a) IC 4296 (7 × 7 arcsec2) and (b) NGC 3557 (11 × 7 arcsec2) taken in the F555W filter. In both images, the pixel scale
and the image FWHM are 0.1 arcsec pixel−1and 0.08 arcsec, respectively. The insets show superposed red contours of CO integrated intensity drawn at 1, 3,
9 times the 3σ rms noise level. Additional information on the optical images is provided in appendix A.
Downloaded from ht tps: //academic. oup. com/ mnras/ art icle-abst ract /484/ 3/ 4239/ 5299582 by guest on 15 F ebruary 2019