2021-02-08T11:25:25Z
Acceptance in OA@INAF
ALMA reveals starburst-like interstellar medium conditions in a compact
star-forming galaxy at z 2 using [CI] and CO
Title
Popping, G.; DECARLI, ROBERTO; Man, A.W.S.; Nelson, E.J.; Bethermin, M.; et
al.
Authors
10.1051/0004-6361/201730391
DOI
http://hdl.handle.net/20.500.12386/30227
Handle
ASTRONOMY & ASTROPHYSICS
A&A 602, A11 (2017) DOI:10.1051/0004-6361/201730391 c ESO 2017
Astronomy
&
Astrophysics
ALMA reveals starburst-like interstellar medium conditions
in a compact star-forming galaxy at z
∼
2 using [CI] and CO
Gergö Popping
1, Roberto Decarli
2, Allison W. S. Man
1, Erica J. Nelson
3, Matthieu Béthermin
1, 4, Carlos De Breuck
1,
Vincenzo Mainieri
1, Pieter G. van Dokkum
5, Bitten Gullberg
6, Eelco van Kampen
1,
Marco Spaans
7, and Scott C. Trager
71 European Southern Observatory, Karl-Schwarzschild-Strasse 2, 85748 Garching, Germany
e-mail: [email protected]
2 Max-Planck Institut für Astronomie, Königstuhl 17, 69117 Heidelberg, Germany
3 Max-Planck-Institut für Extraterrestrische Physik (MPE), Giessenbachstr., 85748 Garching, Germany 4 Aix Marseille Univ., CNRS, LAM, Laboratoire d’Astrophysique de Marseille, Marseille, France 5 Astronomy Department, Yale University, New Haven, CT 06511, USA
6 Centre for Extragalactic Astronomy, Department of Physics, Durham University, South Road, Durham DH1 3LE, UK 7 Kapteyn Astronomical Institute, University of Groningen, Postbus 800, 9700 AV Groningen, The Netherlands
Received 4 January 2017/ Accepted 9 March 2017
ABSTRACT
We present ALMA detections of the [CI] 1–0, CO J= 3–2, and CO J = 4–3 emission lines, as well as the ALMA band 4 continuum for a compact star-forming galaxy (cSFG) at z = 2.225, 3D-HST GS30274. As is typical for cSFGs, this galaxy has a stellar mass of 1.89 ± 0.47 × 10¹¹M
, with a star formation rate (SFR) of 214 ± 44 M yr−1putting it on the star-forming “main-sequence”, but
with an H-band effective radius of 2.5 kpc, making it much smaller than the bulk of “main-sequence” star-forming galaxies. The intensity ratio of the line detections yield an ISM density (∼6 × 104cm−3) and a UV-radiation field (∼2 × 10⁴G
0), similar to the values
in local starburst and ultra-luminous infrared galaxy environments. A starburst phase is consistent with the short depletion times
(tH2,dep≤ 140 Myr) we find in 3D-HST GS30274 using three different proxies for the H2mass ([CI], CO, dust mass). This depletion
time is significantly shorter than in more extended SFGs with similar stellar masses and SFRs. Moreover, the gas fraction of 3D-HST GS30274 is smaller than typically found in extended galaxies. We measure the CO and [CI] kinematics and find a FWHM line width of ∼750 ± 41 km s−1. The CO and [CI] FWHM are consistent with a previously measured Hα FWHM for this source. The line widths
are consistent with gravitational motions, suggesting we are seeing a compact molecular gas reservoir. A previous merger event, as suggested by the asymmetric light profile, may be responsible for the compact distribution of gas and has triggered a central starburst event. This event gives rise to the starburst-like ISM properties and short depletion times in 3D-HST GS30274. The centrally located and efficient star formation is quickly building up a dense core of stars, responsible for the compact distribution of stellar light in 3D-HST GS30274.
Key words. galaxies: high-redshift – galaxies: evolution – galaxies: ISM – ISM: atoms – ISM: molecules – ISM: lines and bands
1. Introduction
Recently, significant progress has been made in understanding the formation of the dense cores of massive galaxies. These forming cores have been discovered in the form of a popula-tion of massive (M∗> 1010M ), compact, star-forming galaxies (cSFGs) at z ≥ 2 (Barro et al. 2013,2014a;Nelson et al. 2014; Williams et al. 2014; van Dokkum et al. 2015). cSFGs are in a dusty star-forming phase (Nelson et al. 2014;Barro et al. 2014a; van Dokkum et al. 2015) with star formation rates (SFRs) sim-ilar to or slightly lower than in star-forming galaxies on the main-sequence of star formation. cSFGs galaxies have similar morphological properties as compact quiescent galaxies, includ-ing high Sérsic indices, and centrally concentrated luminosity profiles. A comparison in the evolution of their respective num-ber densities suggested that cSFGs are the direct progenitors of compact quenched objects (Barro et al. 2013;van Dokkum et al. 2015). This hypothesis was supported by near-IR (NIR) spec-troscopy of a sample of cSFGs which revealed that their Hα and [OIII] emission line widths are similar to the observed stellar
velocity dispersion of compact quiescent galaxies (Nelson et al. 2014;Barro et al. 2014b).
Barro et al.(2014b) found that cSFGs have integrated veloc-ity dispersions with full-width-half-maximum (FWHM) veloci-ties as high as 600 km s−1.van Dokkum et al.(2015) argued that the broad Hα line widths are driven by reservoirs of centrally-located rapidly-rotating gas. High spatial-resolution ALMA ob-servations of the sub-mm continuum in cSFGs show that these galaxies have very compact dust emission, up to more than a factor of two smaller than the stellar emission (Barro et al. 2016; Tadaki et al. 2017). From the observed dust emission, Barro et al. (2016) and Tadaki et al. (2017) measured gas de-pletion times of only a few hundred Myr, similar to their es-timated quenching timescales. The compact stellar, and dust morphologies are likely the result of dissipational processes, which in turn increase the velocity dispersions (Barro et al. 2013, 2014a; van Dokkum et al. 2015). This scenario for the compact distribution of matter in cSFGs is supported by the-oretical models. These suggest that disc instabilities or gas-rich merger events can indeed drive the compaction of gas and
induce a nuclear starburst event that quickly reduces the galaxy half-light radius (Barnes & Hernquist 1991;Mihos & Hernquist 1994; Wellons et al. 2015; Zolotov et al. 2015). The nuclear starburst will quickly build a compact stellar centre, possibly drive an outflow, and transform larger, star-forming galaxies into compact quiescent galaxies over a short time (Zolotov et al. 2015).Genzel et al.(2014) observed the signatures of strong nu-clear outflows in the ionized gas kinematics of massive galaxies, some of which can be classified as cSFGs.
The properties of the atomic and molecular gas are a key piece of information missing in this scenario. Because the shut down of star formation is thought to be imminent in cSFGs (van Dokkum et al. 2015), a measurement of their gas mass and depletion time is essential. If cSFGs have a strong ongoing nu-clear starburst, it is to be expected that the molecular gas has a short depletion time. The gas should furthermore have high densities with a strong impinging radiation field from young stars. The spatial distribution and kinematics of ionized gas suggests that cSFGs have rotating disks of ionized gas that are a factor of two more extended than the stellar distribution (van Dokkum et al. 2015). A key test of whether we are actually observing the building of the dense cores of massive galaxies through in situ star formation is a measurement of a high line width in molecular gas (e.g.,Tacconi et al. 2006,2008). Sub-mm line information probing the molecular gas content, the molecu-lar gas conditions (density, radiation field), and the molecumolecu-lar gas kinematics are thus crucial to understand the nature of cSFGs.
Barro et al.(2016) used ALMA band 7 continuum imaging to probe the gas depletion time of six cSFGs and found that they are typically shorter than in extended main-sequence galax-ies with similar stellar masses, SFRs, and redshift (Spilker et al. 2016). Different groups have observed the gas content of extended main-sequence galaxies at z > 0 either through their 12CO (hereafter CO) emission or the dust continuum (e.g.,Aravena et al. 2010;Daddi et al. 2010;Tacconi et al. 2010; Geach et al. 2011; Aravena et al. 2012; Magdis et al. 2012a,b; Bauermeister et al. 2013; Saintonge et al. 2013; Tacconi et al. 2013; Tan et al. 2013; Santini et al. 2014; Béthermin et al. 2015; Daddi et al. 2015; Genzel et al. 2015; Berta et al. 2016; Decarli et al. 2016; Scoville et al. 2016; Papovich et al. 2016). Both approaches (CO and dust) rely on uncertain conversion fac-tors between the observed luminosity and an estimated gas mass. Independent measures of the gas mass in galaxies are therefore necessary to overcome the systematic uncertainty in these con-version factors and constrain galaxy gas masses. This is espe-cially relevant in cosmic-ray or X-ray dominated environments such as starbursts and active galactic nucleus (AGN) hosting galaxies (Bisbas et al. 2015;Glover & Clark 2016), the environ-ments one can expect to exist in cSFGs.
Atomic carbon ([CI]) can be used to measure the physical properties of the interstellar medium (ISM) in addition to the conventional methods described above. The optically thin [CI] is a good tracer of the surface of molecular clouds. The optically thick CO traces the gas in cores shielded from UV radiation. Cosmic ray ionization allows for the co-existence of CO and [CI], for instance in starburst environments. [CI] emission can thus especially in these environments be used as a good tracer of the H2 mass in galaxies (Weiß et al. 2005; Papadopoulos et al. 2004).Bisbas et al.(2015) indeed showed that under the influ-ence of a strong cosmic-ray field [CI] is a better tracer of the H2 mass than CO. Independently,Glover & Clark(2016) also found that [CI] is a better tracer of H2in cosmic-ray dominated regions. Additionally, the line ratios between [CI] and CO emission can be used to constrain the UV radiation field and density of the
ISM (e.g.,Meijerink et al. 2007;Alaghband-Zadeh et al. 2013; Bothwell et al. 2017). Combining observations of the carbon fine-structure lines with CO is therefore a great strategy to build a more complete picture of the ISM characteristics (H2mass, gas density, and UV radiation field) and study the mode of star for-mation in cSFGs. The CO and [CI] emission line detections can simultaneously be used to study the dynamics of the atomic and molecular gas in cSFGs.
In this paper we present Atacama Large sub/millimeter ar-ray (ALMA) detections of the CO J = 3–2, CO J = 4–3, and the [CI]3P
1–3P0 (hereafter [CI] 1–0) emission lines and band 4 continuum in a cSFG at z= 2.225, 3D-HST GS30274. We study CO and [CI] kinematics, the density and UV radiation field of the ISM, and the global gas properties such as gas fraction and gas depletion time. In Sect. 2 we present the selection of 3D-HST GS30274 and the observations. The line and continuum de-tection of 3D-HST GS30274 and their analysis are presented in Sect.3. We discuss our findings in Sect.4and present our con-clusion in Sect.5. Throughout this paper we assume a Chabrier initial mass function (Chabrier 2003). All presented gas masses are pure molecular hydrogen-masses and do not include a cor-rection for Helium unless stated otherwise.
2. Observations and data reduction 2.1. Target selection
To select a cSFG a preliminary sample was drawn from the GOODS-South region in the 3D-HST catalogue (Skelton et al. 2014) that includes photometry from the U-band to the Spitzer 8 µm band. Using a BzK selection technique (Daddi et al. 2004) we selected galaxies that fall on the main-sequence of star-formation (Noeske et al. 2007;Daddi et al. 2008;Whitaker et al. 2014). We then requested the galaxies to have 1) a secure spec-troscopic redshift between 2.0 and 2.5, to assure that the CO J = 4–3 and the [CI] 1–0 line could be observed simulta-neously within the same tuning; 2) a counterpart in the blind fields from Herschel/PACS (Magnelli et al. 2013) and SPIRE (Roseboom et al. 2010).
From the galaxies in the GOODS-South region from the 3D-HST survey that meet these criteria, we select the most massive cSFG following the classification byvan Dokkum et al. (2015, log (M∗/M ) > 10.5 and log (re/kpc) < log (M∗/M ) − 10.7): 3D-HST GS30274. This source has an effective radius of 2.5 ± 0.1 kpc (van der Wel et al. 2014, flag for the fit equals 2, which marks it as a bad fit). The Sérsic index of this galaxy is not well defined. The poor flag for the fitting and the unde-fined Sérsic index are the result of an asymmetric stellar light profile to the west of the centre of 3D-HST GS30274, sugges-tive of a merger remnant (Fig.1). 3D-HST GS30274 is a hard X-ray source with a luminosity of 1.15 × 1043erg s−1, classi-fied to have an AGN (Xue et al. 2011; Luo et al. 2017). Line ratios of the Hα, [OI], [OIII], [SII], and [NII] emission lines also suggest 3D-HST GS30274 has an AGN (van Dokkum et al. 2005;Genzel et al. 2014). Moreover, this object is detected in the 1.4 GHz Very Large Array catalogue of the Extended Chan-draDeep Field South with a flux of 84.2 ± 6.1 µJy (Bonzini et al. 2012).Genzel et al.(2014) attributed the broad Hα profile in 3D-HST GS30274 to be outflow-driven, thoughvan Dokkum et al. (2015) argues that a large fraction of the broad line width can be explained by compact quickly rotating ionized gas.
The stellar mass and SFR for this galaxy were calcu-lated by fitting the spectral energy distribution (SED) using MAGPHYS (da Cunha et al. 2008, 2015), including photometry
G. Popping et al.: Starburst-like interstellar medium conditions in a compact star-forming galaxy at z ∼ 2
Fig. 1.A Hubble Space Telescope F160W/F105W/F435W RGB image
of 3D-HST GS30274. The images were obtained as a part of the Cos-mic Assembly Near-infrared Deep Extragalactic Legacy Survey (CAN-DELS,Grogin et al. 2011;Koekemoer et al. 2011). The source to the north of our target is a lower-redshift foreground galaxy. The ALMA band 4 continuum detection of 3D-HST GS30274 is shown as contours (2, 3, 4, and 5 sigma). The HST RGB shows an asymmetric light-profile to the west of the core in 3D-HST GS30274, indicative of a recent merger event.
fromSkelton et al.(2014) as well as the Herschel data presented inMagnelli et al.(2013) andRoseboom et al.(2010). Including also the ALMA band 4 continuum (see Sect. 3) we find a stellar mass and SFR of 1.89 ± 0.47 × 10¹¹M and 214 ± 44 M yr−1, respectively. We present the photometry used for the SED fitting in TableA.1. The spectral energy distribution (SED) and the fit to it is presented in Fig. 2. The global properties of 3D-HST GS30274 that we obtained from the SED fitting are presented in Table1.
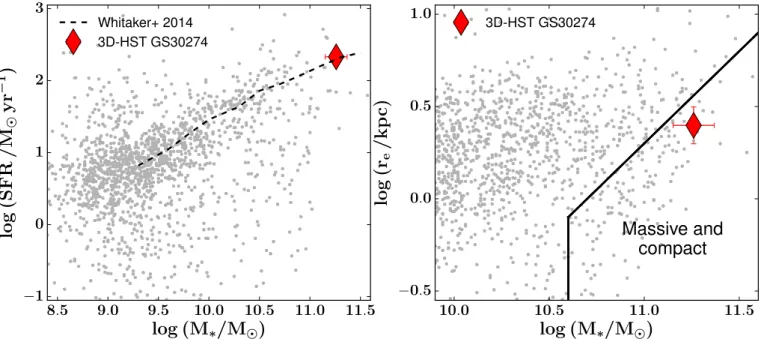
The location of 3D-HST GS30274 on the stellar mass – SFR relation and stellar mass – size relation of galaxies is shown in Fig.3. Its compact size and its location on the main-sequence meet the criteria set byBarro et al.(2013) andvan Dokkum et al. (2015) to classify 3D-HST GS30274 as a typical cSFG.
2.2. Observations
The ALMA observations of 3D-HST GS30274 were carried out under project 2015.1.00228.S (PI: G. Popping). Band 3 observa-tions of 3D-HST GS30274 were performed on January 12 2016 with a compact configuration (C36-1; shortest and longest base-lines were 15.1 and 331 m, respectively with an rms of 126.9 m). The water vapour during the observations was PWV= 5 mm. The integration time on 3D-HST GS30274 was 46 min. The data were calibrated using the standard ALMA pipeline (CASA version 4.5.1). One spectral window was centred at 99.322 GHz with a bandwidth of 1.875 GHz covering 3840 channels, to tar-get the CO J = 3–2 emission line. The other spectral windows were centred at 95.182, 107.199, and 105.241 GHz with a band-width of 1.875 GHz covering 128 channels. These spectral win-dows were used to observe the band 3 continuum of 3D-HST GS30274. Images were produced using the CLEAN task in CASA
−0.5 0.0 0.5 1.0 1.5 2.0 2.5 3.0 3.5 log λ [µm] −4 −3 −2 −1 0 1 log Fν [mJy ]
ALMA band 3 upper limit ALMA band 4
Fig. 2. Multi-wavelength spectral energy distribution of 3D-HST GS30274. The best fit from the MAGPHYS analysis is plotted as a line. The optical, NIR, Herschel measurements are shown as bold circles. The ALMA band 4 continuum detection is presented as a red square. The red diamond represents the three sigma upper limit on the ALMA band 3 continuum.
(McMullin et al. 2007), with a natural weighting. This resulted in a synthetic beam size of 3.4 × 2.16 arcsec2 with a position angle of 274 deg. The typical rms noise level is 0.012 mJy/beam for the continuum and 0.16 mJy/beam/(100 km s−1) for the CO J= 3–2 line.
The band 4 observations of 3D-HST GS30274 were per-formed on January 17, 2016 and January 21, 2016 with the same configuration as for the band 3 observations. The water vapour during the observations was PWV = 4.4 mm on January the 17th and PWV = 2 mm on January the 21st. The total inte-gration time on 3D-HST GS30274 in band 4 was 89 minutes. The data were calibrated using the standard ALMA pipeline. One spectral window was centred at 142.568 GHz with a band-width of 1.875 GHz covering 240 channels, to target the CO J = 4–3 emission line. A second spectral window was centred at 152.610 GHz with a bandwidth of 1.875 GHz covering 240 channels to target the [CI] 1–0 emission line. Two additional spectral windows were placed at 140.693 and 154.551 GHz with a bandwidth of 1.875 GHz covering 128 channels. These spectral windows were used to measure the band 4 continuum emission of 3D-HST GS30274. The imaging was done with the CLEAN task with natural weighting and resulted in a synthetic beam size of 2.22 × 1.54 arcsec2with a position angle of 76 deg. The typ-ical rms noise level is 0.014 mJy/beam for the continuum and 0.076 mJy/beam/(100 km s−1) for the CO J = 4–3 line and 0.08 mJy/beam/(100 km s−1) for the [CI] 1–0 line.
3. Results and analysis
3.1. Emission line and continuum detections
We present moment zero maps of the CO J= 3–2, J = 4–3, and [CI] 1–0 emission of 3D-HST GS30274 in Fig.4. We also show the band 4 continuum at a rest-frame wavelength of 660 µm. We see clear detections of the targeted CO and [CI] emission lines and the band 4 continuum. We detect the CO J = 3–2, J = 4–3, and the [CI] 1–0 line a signa-to-noise ratio of 12.8, 27, and 10.7, respectively. The band 4 continuum at a rest-frame wavelength of 660 µm is detected with a signal-to-noise ratio of A11, page 3 of10
8.5 9.0 9.5 10.0 10.5 11.0 11.5
log (M
∗/M
)
−1 0 1 2 3log
(SFR
/
M
yr
− 1)
Whitaker+ 2014 3D-HST GS30274 10.0 10.5 11.0 11.5log (M
∗/M
)
−0.5 0.0 0.5 1.0log
(r
e/
kp
c)
Massive and
compact
3D-HST GS30274Fig. 3. Left: location of 3D-HST GS30274 in the stellar mass vs. SFR plane of galaxies. The grey dots show galaxies taken from all five 3D-HST/CANDELS fields (Momcheva et al. 2016) in the redshift range 2.0 < z < 2.5. The black line show a fit to the these galaxies from
Whitaker et al.(2014). The source in this study, 3D-HST GS30274, shown as a red diamond, lies on top of the main-sequence of galaxies at these redshifts, at the high-mass end. Right: size-mass relation of galaxies with redshifts 2.0 < z < 2.5 from the five 3D-HST/CANDELS fields (Momcheva et al. 2016;van der Wel et al. 2014). The solid lines define thevan Dokkum et al.(2015) selection criteria for compact, massive galaxies: log (M∗/M ) > 10.5 and log (re/kpc) < log (M∗/M ) − 10.7. 3D-HST GS30274 is shown as a red diamond and falls within the area for
compact, massive galaxies.
Table 1. Global properties of 3D-HST GS30274.
RA Dec z M∗ S FR re Mdust Tdust M[CI] LIR
deg deg 1011M M yr−1 kpc 108M K 106M 1012L
53.13108 –27.77311 2.225 1.89 ± 0.47 214 ± 44 2.5 ± 0.1 2.5 ± 0.6 45 ± 5 5.4 ± 1.4 2.3 ± 0.6
Table 2. Observed sub-mm properties of 3D-HST GS30274.
Feature Iline L0line S660 µm
Jy km s−1 109K km s−1pc2 mJy
CO (3–2) 0.77 ± 0.06 21.0 ± 1.6 ...
CO (4–3) 1.08 ± 0.04 16.5 ± 0.5 ...
[CI] (1–0) 0.32 ± 0.03 4.3 ± 0.4 ...
660 µma ... ... 0.085 ± 0.014
Notes.(a)Restframe wavelength.
6.1. The band 3 continuum at a rest-frame wavelength of 976 µm is not detected, consistent with the flux intensity predicted by the MAGPHYS SED fit (Fig.2). In none of the cases do we spatially resolve the galaxy. This was to be expected, as its NIR half-light radius (0.53 arcsec Skelton et al. 2014) is significantly smaller than the minor axis of the primary beam obtained in the ALMA images (2.4 arcsec in band 3 and 1.54 arcsec in band 4).
We show the flux density profile of the CO J = 3–2, J = 4–3, and [CI] 1–0 detections in Fig. 5. We calculate the CO and [CI] line luminosities using the following relation (Solomon & Vanden Bout 2005)
L0(K km s−1pc2)= 3.25 × 10⁷S∆v ν−2obsD2L(1+ z)−3, (1) where S∆v is the integrated flux in units of Jy km s−1, DL the luminosity distance in Mpc, and νobs the observed central
frequency of the line. The integrated flux densities and line and continuum luminosities for 3D-HST GS30274 are presented in Table2.
3.2. Infrared luminosity, stellar mass, SFR, and dust mass We measure a total infrared (IR; 8–1000 µm) luminosity for 3D-HST GS30274 of LIR= 2.3±0.6 ×10¹²L . This was obtained by fitting the ALMA band 4, the Herschel/ PACS (Magnelli et al. 2013) and SPIRE continuum (Roseboom et al. 2010), and op-tical and NIR data photometry (Skelton et al. 2014) with the MAGPHYS (da Cunha et al. 2008) model (see Fig. 2). These fits suggest a dust mass of 2.5 ± 0.6 × 10⁸M , a dust temperature of 45 ± 5 K, and a stellar mass and SFR of 1.89 ± 0.47 × 10¹¹M and 214 ± 44 M yr−1, respectively. The inferred IR luminosity classifies 3D-HST GS30274 as a ULIRG. This was expected as the most massive main-sequence galaxies at z ∼ 2 are indeed ULIRGs (Daddi et al. 2005;Rodighiero et al. 2011).
Despite the presence of a bright AGN, it is unlikely that it strongly affects the SED fitting of 3D-HST GS30274. The UV-to-sub-mm SED of 3D-HST GS30274 can be well fitted by a stars-only model. Additionally, the galaxy shows a strong Balmer break at a rest-frame wavelength of λrest ∼ 4000 Å, which strongly constrains the contribution from an AGN to the continuum emission (Kriek et al. 2007;Marsan et al. 2015). Only at observed wavelengths of 8 and 100 µm does the MAGPHYS fit underestimate the observed flux. A comparison
G. Popping et al.: Starburst-like interstellar medium conditions in a compact star-forming galaxy at z ∼ 2 3h32m31.00s 31.20s 31.40s 31.60s 31.80s 32.00s RA (J2000) 30.0" 27.0" 24.0" 21.0" -27°46'18.0" Dec (J2000)
Continuum
0.01 0.00 0.01 0.02 0.03 0.04 0.05 0.06 0.07 0.08 Flux (mJy/beam) 3h32m31.00s 31.20s 31.40s 31.60s 31.80s 32.00s RA (J2000) 30.0" 27.0" 24.0" 21.0" -27°46'18.0" Dec (J2000)CO 3-2
0.08 0.00 0.08 0.16 0.24 0.32 0.40 0.48 0.56 Flux (mJy/beam) 3h32m31.00s 31.20s 31.40s 31.60s 31.80s 32.00s RA (J2000) 30.0" 27.0" 24.0" 21.0" -27°46'18.0" Dec (J2000)CO 4-3
0.00 0.15 0.30 0.45 0.60 0.75 0.90 Flux (mJy/beam) 3h32m31.00s 31.20s 31.40s 31.60s 31.80s 32.00s RA (J2000) 30.0" 27.0" 24.0" 21.0" -27°46'18.0" Dec (J2000)[CI] 1-0
0.10 0.05 0.00 0.05 0.10 0.15 0.20 0.25 Flux (mJy/beam)Fig. 4.Moment zero maps of the band 4 continuum (top left), the CO J= 3–2 line (top right), the CO J = 4–3 line (bottom left), and the [CI] 1–0 line (bottom right). The size of the beam is indicated in the lower left corner. The lines were integrated between –600 and+600 km s−1. All the
lines and the underlying continuum in band 4 are clearly detected.
between the IR part of the SED of 3D-HST GS30274 and the templates presented inKirkpatrick et al.(2015) suggests that an additional contribution of 20% to the total IR luminosity by an AGN can make up for the mismatch between the observed and fitted SED. This contribution would come on top of the emission already accounted for by stars and star formation.
3.3. Kinematics
The spectra presented in Fig. 5 can be well fitted with a single gaussian with a dispersion of 328 ± 38, 321 ± 19, and 289 ± 39 km s−1for the CO J = 3–2, CO J = 4–3, and [CI] 1– 0 lines, respectively. This corresponds to a FWHM of 764 ± 88, 751 ± 44, and 675 ± 92 km s−1, respectively. The gaussians are represented by the dashed black lines in Fig. 5. The velocity profile does not show the classic “double horned” structure that might be expected in a gas disk with a smooth surface bright-ness distribution. This may indicate significant random motions, a complex gas distribution, or a combination. We do not find any signatures in the flux density profile for a CO or [CI] outflow, such as a broad second gaussian component or a bright CO/[CI] component blue- and/or redshifted from the source systematic
velocity. This does not necessarily suggest that no outflow is present. If outflows are present the observations are not deep enough to retrieve their weak signal. Furthermore, the spatial resolution might be too low to distinguish a blue- and/or red-shifted component away from the galaxy centre.
3.4. Comparing line ratios with PDR models
To explore the properties of the ISM in 3D-HST GS30274 we compare the intensity ratios of the [CI] and CO lines to the outputs of molecular cloud models. We present the [CI] 1– 0/ CO J = 4–3 luminosity ratio of 3D-HST GS30274 as a function of its [CI] 1–0/ FIR luminosity ratio in Fig. 6 (left panel). We overplotted the density and UV radiation field con-tours as presented inAlaghband-Zadeh et al.(2013), based on theKaufman et al.(1999) andKaufman et al.(2006) PDR mod-els. With this approach we find that 3D-HST GS30274 has a density of (6 ± 0.5) × 104cm−3 and a UV radiation field of (2 ± 2) × 104G
0. The models of Meijerink & Spaans (2005) and Meijerink et al. (2007) suggest that the ISM of 3D-HST GS30274 has a density of a few times 105cm−3. Unfortunately, A11, page 5 of10
−2000 −1000 0 1000 2000 velocity (km/s) −0.5 0 0.5 1.0 1.5 flux densit y (mJy ) CO J=3-2 −2000 −1000 0 1000 2000 velocity (km/s) −0.5 0 0.5 1.0 1.5 flux densit y (mJy ) CO J=4-3 −2000 −1000 0 1000 2000 velocity (km/s) −0.5 0 0.5 1.0 1.5 flux densit y (mJy ) [CI] (1-0)
Fig. 5. Integrated flux density of the CO J = 3–2 (left), CO J = 4–3 (middle), and [CI] 1–0 (right) emission lines in 3D-HST GS30274. The dashed line marks the gaussian fit to the density profile. All the lines are clearly detected and can be well fitted by a Gaussian.
Fig. 6.Left: [CI] 1–0/ CO J = 4–3 luminosity ratio of 3D-HST GS30274 as a function of its [CI] 1–0/ FIR luminosity ratio. In this case the
lumi-nosities were taken to be in solar units. Coloured lines represent the density and UV radiation field contours as presented inAlaghband-Zadeh et al.
(2013), based on theKaufman et al.(1999,2006) PDR models. These line ratios provide us with a good constraint on the UV radiation field and add an additional constraint on the gas density. Right: density and UV radiation field of 3D-HST GS30274 compared to the densities and radia-tion fields of main-sequence galaxies (Malhotra et al. 2001), local starburst galaxies (Stacey et al. 1991), and local ULIRGS (Davies et al. 2003). The density of 3D-HST GS30274 is similar to densities seen in local starbursts and ULIRGS, whereas the UV radiation field is similar to local ULIRGS.
the Meijerink et al. models do not constrain the UV radiation field in 3D-HST GS30274 very well.
Although UV-to-sub-mm continuum SED fitting suggest that the AGN does not dominate the emission from 3D-HST GS30274, we did compare the observed line intensities to an X-ray Dominated Region (XDR) code (Meijerink & Spaans 2005;Meijerink et al. 2007). The XDR-code was not able to re-produce the [CI] 1–0/ CO J = 3–2 intensity ratio, whereas only poor convergence was reached for the [CI] 1–0/ CO J = 4–3 intensity ratio suggesting densities larger than 106.5cm−3. This supports the finding that the AGN only plays a minor role in the emission from 3D-HST GS30274.
The constraints on the density and UV radiation field of the molecular ISM in 3D-HST GS30274 are similar to the condi-tions observed in ultra-luminous infrared galaxies (ULIRGS) and local (nuclear) starbursts (right panel of Fig. 6. Multi-ple independent studies have estimated a molecular ISM den-sity of ∼105cm−3 in the local nuclear starburst NGC 253
(Bayet et al. 2004;Meier et al. 2015). The density and UV ra-diation field in the starburst region of Arp 220 is estimated to be 104–105cm−3and ∼4 × 10⁴G0 (e.g.,Gerin & Phillips 1998; Aalto et al. 2009;Scoville et al. 2015).Israel et al.(2015) used the line-ratio between [CI] and CO to study the ISM in a sam-ple of local (nuclear) starbursts and estimated an average ISM density of 104–105cm−3. Molecular emission-line studies of the nuclear region of M82 suggest the presence of dense compo-nents with densities up to 106cm−3and a UV radiation field up to 1.8 × 10³(Bayet et al. 2008;Loenen et al. 2010).Pineda et al. (2012) found an average hydrogen density of ∼105cm−3 and a UV radiation field of 3.1 × 10³G0in the starburst region 30 Do-radus.Chevance et al.(2016) estimates a UV radiation field up to 1.8 × 10⁴G0in 30 Doradus.
The estimated ISM properties for 3D-HST GS30274 are on average in the same range as the ISM properties found in local ULIRGS and starbursts. This suggests that the molecular ISM in 3D-HST GS30274 is in a starburst phase.
G. Popping et al.: Starburst-like interstellar medium conditions in a compact star-forming galaxy at z ∼ 2
Table 3. H2mass, relative amount of H2, and H2depletion time of 3D-HST GS30274 derived by adopting the following approaches; [CI]: an H2
mass based on atomic carbon; CO: an H2mass based on the CO J= 3–2 luminosity; dust mass: an H2mass based on the inferred dust mass from
SED fitting in combination with a gas-to-dust ratio.
Approach H2mass (1010M ) MH2/(MH2+ M∗) H2depletion time (Myr)
[CI] 3.0 ± 0.3 0.14 ± 0.01 140 ± 30
CO starburst αCO 1.7 ± 0.1 0.08 ± 0.005 80 ± 17
Dust mass <0.7 ± 0.2 <0.04 ± 0.01 <30 ± 10
3.5. H2mass
In this subsection we will derive the H2 mass of 3D-HST GS30274 using three different approaches. We summarise the obtained H2masses in Table3.
3.5.1. Based on [CI]
To derive the H2mass of 3D-HST GS30274 from the [CI] emis-sion we first need to estimate the total carbon mass in 3D-HST GS30274. We derive the atomic carbon mass following Weiß et al.(2005), calculated from the [CI] 1–0 line luminosity as
M[CI](M )= 5.706 × 10⁻⁴Q(Tex)1 3e
23.6/TexL0
[CI](1−0), (2)
where Tex is the excitation temperature of [CI] and Q(Tex) = 1 + 3e−T1/Tex + 5e−T2/Tex is the [CI] partition function. T
1 and
T2 are the energies above the ground state, 23.6 K and 62.5 K, respectively.
Without knowledge of the [CI] 2–1 luminosity, we have to make an assumption for the excitation temperature of atomic carbon. We assume Tex= 30 K, the average excitation tempera-ture found inWalter et al.(2011). This results in a carbon mass of 5.4 ± 1.4 × 10⁶M . This carbon mass is similar to the mass found in z > 2 dusty SFGs and quasar host galaxies (Walter et al. 2011).
The derived density and UV radiation field would suggest a much higher excitation temperature of ∼200 K for atomic carbon (Meijerink et al. 2007; Kaufman et al. 2006). Here it is impor-tant to remember that PDR models assume a specific geometry and a homogeneous medium (which is probably an unrealistic assumption). Line intensity ratios are sensitive to the chosen ge-ometry, and especially the intensity ratio between [CI] 2–1 and [CI] 1–0 is sensitive to the homogeneity of the medium (Spaans 1996). This is further demonstrated by the difficulty models have in reproducing this intensity ratio in environments with low-UV radiation fields and well defined spherically-symmetric density profiles (e.g.,Pineda & Bensch 2007;Papadopoulos et al. 2004). Danielson et al. (2011) observed atomic carbon and CO in a lensed DSFG at z ∼ 2.3 with similar density and UV radia-tion field as 3D-HST GS30274. Its carbon and CO line ratios suggest an excitation temperature of a few hundred K. The car-bon excitation temperature directly derived from the observed [CI] 2–1 and [CI] 1–0 luminosity ratio is 25–45 K, significantly lower. We therefore stick to the assumed excitation temperature of Tex = 30 K, rather than adopting high temperatures of a few hundred degrees. If we were to change the carbon excitation tem-perature to for instance the dust temtem-perature of the ISM in 3D-HST GS30274 (45 K), this would result in a change in carbon mass (and resulting H2mass) of less than 3%.
The derived carbon mass of a galaxy can be used to estimate its H2 mass (e.g., Papadopoulos et al. 2004; Weiß et al. 2005; Wagg et al. 2006; Alaghband-Zadeh et al. 2013; Béthermin et al. 2016; Bothwell et al. 2017). [CI] is es-pecially a good tracer in X-ray and cosmic-ray dominated en-vironments (Bisbas et al. 2015; Glover & Clark 2016). We es-timate the H2 mass of 3D-HST GS30274 from its atomic carbon mass, assuming a carbon abundance of X[CI] = M[CI]/(6 MH2) = 3 × 10⁻⁵ (Weiß et al. 2005; Danielson et al. 2011;Alaghband-Zadeh et al. 2013). We implicitly make the as-sumption that the atomic carbon is mostly neutral. The adopted carbon abundance is slightly higher than the Galactic abun-dance of 2 × 10⁻⁵(Frerking et al. 1989). We estimated a metal-licity of 12+ log (O/H) = 9.07 for 3D-HST GS30274 of us-ing the fundamental metallicity relation (Mannucci et al. 2010). Our choice for X[CI] = 3 × 10⁻⁵ agrees well with theoreti-cal estimates of the carbon abundance in metal-rich environ-ments byGlover & Clark (2016). We measure a molecular hy-drogen mass of MH2([CI])= 3.0 ± 0.3 × 10¹⁰M . The Galactic abundance of 2 × 10⁻⁵ would have resulted in an H
2 mass of MH2([CI])= 4.5 ± 0.4 × 10¹⁰M .
3.5.2. Based on CO
To use the CO J= 3–2 emission as a tracer of H2mass we first have to derive the CO J= 1–0 line luminosity from the CO J = 3–2 line luminosity. The ratio between the squared CO J= 4–3 and CO J= 3–2 intensities is I2
CO4−3/I
2
CO3−2= 1.9 ± 0.3. This is
close to the line ratio one would expect if the lines are all in the Rayleigh–Jeans limit and in local thermodynamic equilibrium (LTE; (J = 42)/(J= 32)= 1.78). We therefore assume that the flux intensity ratio between the CO J= 3–2 and CO J = 1–0 line equals 32/12 = 9. This gives a line luminosity for CO J = 1–0 of 2.1 ± 0.2 × 10⁹K km s−1pc2. The assumption of a thermalized medium for the CO transitions is supported by the strong UV radiation field and high densities derived in Sect.3.4.
In Sect.3.4we concluded that the ISM of 3D-HST GS30274 resembles the ISM in local starburst and starburst nuclei. We therefore adopt a CO-to-H2 conversion factor typically as-sumed for starburst and mergers (αCO= 0.8 M /(K km s−1pc2), Downes & Solomon 1998;Bolatto et al. 2013). This leads to a CO-based H2mass of 1.7 ± 0.1 × 10¹⁰M , approximately half of the mass derived from [CI].
3.5.3. Based on the dust mass
An additional method to measure the gas mass of 3D-HST GS30274 is to use the inferred dust mass of 3D-HST GS30274 from the SED fitting in combination with typically assumed gas-to-dust ratios (Mgas = δGDR(Z)Mdust, where δGDR(Z) is the gas-to-dust ratio and a function of metallicity). We estimate δGDR(Z) A11, page 7 of10
using the empirical calibration ofMagdis et al.(2012a). We then find a gas mass (pure hydrogen) of Mgas = 0.7 ± 0.2 × 10¹⁰M . This mass represents the combined contribution from atomic and molecular gas and sets an upper limit on the H2 mass. We will not attempt to make a correction for this, though theoretical ef-forts suggest that a galaxy with similar stellar mass and SFR as in 3D-HST GS30274 at z ∼ 2 has a molecular hydrogen frac-tion MH2/(MHI+ MH2) ∼ 75% (Popping et al. 2015a). The de-rived upper limit for the H2 content of 3D-HST GS30274 from the dust mass is already three times as low as the [CI]-based H2 estimate.
3.6. Gas depletion time and galaxy gas fraction
We can use the measured H2 masses in combination with the estimated stellar mass and SFR to calculate the gas fraction and gas depletion time of 3D-HST GS30274. The gas frac-tion that we determine using the [CI]-based H2 estimate is MH2/(MH2+ M∗)= 0.14 ± 0.01. The gas depletion time of 3D-HST GS30274 is MH2/SFR = 140 ± 30 Myr. The gas fractions obtained using the other approaches are 0.08 ± 0.005 for the CO-based H2mass and less than 0.04 ± 0.01, for the dust-based H2 mass, whereas the gas depletion times are 80 ± 17 Myr and less than 30 ± 10 Myr for the CO-based and dust-based H2estimates, respectively. The estimated gas fraction and depletion times are both low for star-forming galaxies. For example, they are both lower than what is typically found in the literature for ex-tended star-forming galaxies at similar redshift and stellar mass (Tacconi et al. 2010; Magdis et al. 2012a; Tacconi et al. 2013; Saintonge et al. 2013). The gas fractions found by Barro et al. (2016) for six cSFGs at z ∼ 2.5 are higher than the gas fraction we derived for 3D-HST GS30274. The gas depletion times on the other hand are similar, suggesting 3D-HST GS30274 and the cSFGs in Barro et al.(2016) may have a similar mode of star formation.
3.7. CO-to-H2conversion factor
The independent measurements of the H2mass allow us to con-strain the CO-to-H2conversion factor in 3D-HST GS30274, us-ing the observed CO J = 3–2 emission line. We first have to derive the CO J = 1–0 line luminosity from the CO J = 3–2 line luminosity, for which we use the CO J = 1–0 line lumi-nosity derived in Sect. 3.5.2. We find a CO-to-H2 conversion factor of αCO = MH2/L0CO1−0 = 1.4 ± 0.15 M /(K km s−1pc2). When using the H2 masses based on the total dust mass of 3D-HST GS30274, we find a CO-to-H2 conversion factor of 0.5 ± 0.3 M /(K km s−1pc2), respectively.
The CO-to-H2 conversion factors derived for 3D-HST GS30274 lie below the value typically assumed for main-sequence galaxies (ranging from 3.6 to 4.3 M /(K km s−1pc2), see Bolatto et al. 2013, for a review) and around the value usually assumed for starburst and mergers (αCO = 0.8 M /(K km s−1pc2), Downes & Solomon 1998). This fits in with the finding that the ISM in 3D-HST GS30274 is in a star-burst phase.
3.8. The gas-to-dust ratio
We can constrain the gas-to-dust ratio in 3D-HST GS30274 us-ing the dust mass obtained by SED fittus-ing and the H2 mass ob-tained from the atomic carbon line. We find a molecular gas-to-dust ratio of 165 ± 45 when using the carbon-based H2estimate.
Here we included a 1.36 correction for Helium, similar to gas-to-dust ratios quoted in the literature. We emphasise that we have only accounted for the gas in molecular form and did not cor-rect for atomic hydrogen. Theoretical models and indicor-rectly es-timated gas masses from observations suggest that the molecu-lar hydrogen fraction fH2for a main-sequence galaxy at z ∼ 2 is around 75% (e.g.,Popping et al. 2015b). Taking this correction into account, the resulting gas-to-dust ratio is 221 ± 60. When using the CO-based H2estimate instead we find a molecular gas-to-dust ratio of 94 ± 25 and a total gas-gas-to-dust ratio of 125 ± 33. The CO-based gas-to-dust ratio is similar to the gas-to-dust ra-tio obtained using the empirical fitting relara-tion presented in Magdis et al.(2012a). These observations also confirm that mas-sive galaxies at z ∼ 2 can already be significantly dust-enriched (e.g.,Downes et al. 1992;Berta et al. 2016;Popping et al. 2017; Seko et al. 2016), though the exact level of enrichment highly depends on the chosen H2mass estimator.
4. Discussion
We are now in the unique position to tie the information we ob-tained about the cold gas kinematics and physical properties, the gas fraction and the depletion time, and the studies of ionized gas in the literature together into one complete picture that aims to describe 3D-HST GS30274.
The velocity dispersion that we derive for 3D-HST GS30274 is significantly higher than typically found in extended star-forming galaxies with similar stellar mass and SFR at the same redshift (e.g., Tacconi et al. 2010, 2013). The derived veloc-ity dispersions of CO and [CI] are in agreement with the Hα velocity dispersion for this source (van Dokkum et al. 2015). van Dokkum et al.(2015) showed that the observed velocity dis-persion of the Hα gas in cSFGs is consistent with the disdis-persion expected for a system dominated by gravitational motions (with little contribution from outflows). We can repeat this exercise us-ing the [CI] and CO observations of 3D-HST GS30274. Follow-ingvan Dokkum et al.(2015) the predicted velocity dispersion of a galaxy is
log σpred= 0.5(log M∗− log re− 5.9). (3)
Assuming that the gas and stars are dynamically coupled, we can replace M∗by Mdyn= M∗+ 1.36MH2(where the factor 1.36 accounts for the contribution by Helium). We assume that the effective radius of 2.5 ± 0.1 kpc (van der Wel et al. 2014) is still valid. When using the [CI]-based H2 mass, we find a predicted velocity dispersion for the gas of 340 ± 35 km s−1. We predict ve-locity dispersions of 327 ± 40 and 316 ± 40 km s−1for the CO-and dust-based H2 mass estimates, respectively. The predicted velocity dispersions are similar to the observed velocity disper-sion of the CO lines in 3D-HST GS30274. This suggests that the observed velocity dispersions are consistent with being gravita-tionally driven by a compact distribution of both stars and gas. While AGN or star formation driven winds are likely present in this galaxy (Genzel et al. 2014), they do not appear to dominate the galaxy-integrated line widths in CO or [CI]. These results are a confirmation that we are likely seeing the build-up of the dense core of a massive galaxy.
The derived ISM characteristics match the ISM proper-ties observed in local ULIRGS and starbursts very well (e.g., Bayet et al. 2004; Pineda et al. 2012; Meier et al. 2015, see Sect. 3.4). Additionally, the derived CO-to-H2 conversion fac-tor for 3D-HST GS30274 is within the range typically assumed to starbursting galaxies. We have employed three methods to es-timate the H2mass of 3D-HST GS30274. All these approaches
G. Popping et al.: Starburst-like interstellar medium conditions in a compact star-forming galaxy at z ∼ 2 yield H2 depletion times shorter than typically found in more
extended main-sequence galaxies with similar stellar mass and SFR at these redshifts (≤140 Myr). Such efficient star-formation fits the picture where a starburst is quickly and efficiently deplet-ing the gas reservoir of 3D-HST GS30274. The short depletion time could also suggest that this galaxy is in the process of shut-ting down its star formation. This is consistent with the picture in which the star formation in a galaxy is quenched once it has formed a high stellar surface density core (e.g.,Kauffmann et al. 2003; Franx et al. 2008; Wuyts et al. 2011; Bell et al. 2012; Fang et al. 2013; van Dokkum et al. 2014; Lang et al. 2014; Barro et al. 2017;Whitaker et al. 2015,2017).
3D-HST GS30274 is classified as a merger remnant. A likely scenario for this object is that the merger event triggered com-pactification of the gas and induced a central starburst event. This explains the starburst ISM characteristics, the short deple-tion time, and the CO and [CI] kinematics that are consistent with a compact distribution of the gas. This is confirmation that we are likely seeing the build-up of the dense core in 3D-HST GS30274. This scenario is consistent with one of the scenar-ios suggested byWellons et al.(2015) andZolotov et al.(2015) for the formation of cSFGs. These models suggest that com-paction is triggered by inflow episodes, such as gas-rich mergers, and is commonly associated with violent disc instabilities. The high central concentration of gas then quickly builds up a dense core. It may also accrete efficiently onto a black hole trigger-ing a bright AGN, as observed in the X-ray and radio emission from 3D-HST GS30274. Future high-resolution observations are needed to properly measure the size of the compact molecular gas reservoir and better study the kinematic motions. The pre-sented observations demonstrate that the main-sequence of star formation doesn’t solely consist of “typical star-forming galax-ies”, but can contain galaxies undergoing different modes of star formation.
5. Summary and conclusion
We have presented ALMA CO, [CI], and dust continuum de-tections of the compact star-forming galaxy 3D-HST GS30274. These observations mark the first detections of sub-mm emis-sion lines in cSFGs and provide a new insight into the origin of cSFGs and how they relate to compact quiescent galaxies.
The ratio between the different sub-mm emission lines sug-gests that the ISM is in a starburst phase. This is consistent with the short H2 depletion time of ≤140 Myr we obtained for this source using three different H2 tracers. The observed CO and [CI] dynamical information for 3D-HST GS30274 is consistent with a scenario where the gas in 3D-HST GS30274 is situated in a compact reservoir.
The presented observations point towards a scenario where a previous merger has driven the gas in 3D-HST GS30274 to-wards a compact distribution in the galaxy centre and triggered a nuclear starburst event. The starburst event quickly depletes the cold gas and has started to build up a dense stellar core. The com-pact distribution of gas may feed a black hole which triggers the observed AGN. Ultimately, the combination of short depletion times, the AGN activity, and possibly star-formation driven out-flows may quench 3D-HST GS30274 into a compact quiescent galaxy.
The presented work on 3D-HST GS30274 demonstrates that ALMA detections of sub-mm lines to probe the molecular gas mass, ISM characteristics, and molecular gas dynamics of cS-FGs are an important puzzle piece to understand the formation history of the progenitors of compact quiescent galaxies.
Acknowledgements. A large part of the analysis and writing of this paper was carried out at the ESO guesthouse in Santiago. G.P. (“the appendicitis guy”) thanks the staff of the ESO guesthouse for its hospitality and great care. We thank the referee for a very constructive report. G.P. thanks Karina Caputi, Juan Pablo Pérez-Beaupuits, and Rachel Somerville for stimulating discus-sions during the first stages of this project. Support for R.D. was provided by the DFG priority program 1573 “The physics of the interstellar medium”. B.G. acknowledges support from the ERC Advanced Investigator programme DUSTYGAL 321334. This paper makes use of the following ALMA data: ADS/JAO.ALMA#2015.1.00228.S. ALMA is a partnership of ESO (represent-ing its member states), NSF (USA) and NINS (Japan), together with NRC (Canada), NSC and ASIAA (Taiwan), and KASI (Republic of Korea), in co-operation with the Republic of Chile. The Joint ALMA Observatory is operated by ESO, AUI/NRAO and NAOJ.
References
Aalto, S., Wilner, D., Spaans, M., et al. 2009,A&A, 493, 481
Alaghband-Zadeh, S., Chapman, S. C., Swinbank, A. M., et al. 2013,MNRAS, 435, 1493
Aravena, M., Carilli, C., Daddi, E., et al. 2010,ApJ, 718, 177
Aravena, M., Carilli, C. L., Salvato, M., et al. 2012,MNRAS, 426, 258
Barnes, J. E., & Hernquist, L. E. 1991,ApJ, 370, L65
Barro, G., Faber, S. M., Pérez-González, P. G., et al. 2013,ApJ, 765, 104
Barro, G., Faber, S. M., Pérez-González, P. G., et al. 2014a,ApJ, 791, 52
Barro, G., Trump, J. R., Koo, D. C., et al. 2014b,ApJ, 795, 145
Barro, G., Faber, S. M., Koo, D. C., et al. 2017, ApJ, submitted
[arXiv:1509.00469]
Barro, G., Kriek, M., Pérez-González, P. G., et al. 2016,ApJ, 827, L32
Bauermeister, A., Blitz, L., Bolatto, A., et al. 2013,ApJ, 768, 132
Bayet, E., Gerin, M., Phillips, T. G., & Contursi, A. 2004,A&A, 427, 45
Bayet, E., Lintott, C., Viti, S., et al. 2008,ApJ, 685, L35
Bell, E. F., van der Wel, A., Papovich, C., et al. 2012,ApJ, 753, 167
Berta, S., Lutz, D., Genzel, R., Förster-Schreiber, N. M., & Tacconi, L. J. 2016,
A&A, 587, A73
Béthermin, M., Daddi, E., Magdis, G., et al. 2015,A&A, 573, A113
Béthermin, M., De Breuck, C., Gullberg, B., et al. 2016,A&A, 586, L7
Bisbas, T. G., Papadopoulos, P. P., & Viti, S. 2015,ApJ, 803, 37
Bolatto, A. D., Wolfire, M., & Leroy, A. K. 2013,ARA&A, 51, 207
Bonzini, M., Mainieri, V., Padovani, P., et al. 2012,ApJS, 203, 15
Bothwell, M. S., Aguirre, J. E., Aravena, M., et al. 2017,MNRAS, 466, 2825
Chabrier, G. 2003,PASP, 115, 763
Chevance, M., Madden, S. C., Lebouteiller, V., et al. 2016,A&A, 590, A36
da Cunha, E., Charlot, S., & Elbaz, D. 2008,MNRAS, 388, 1595
da Cunha, E., Walter, F., Smail, I. R., et al. 2015,ApJ, 806, 110
Daddi, E., Cimatti, A., Renzini, A., et al. 2004,ApJ, 617, 746
Daddi, E., Dickinson, M., Chary, R., et al. 2005,ApJ, 631, L13
Daddi, E., Dannerbauer, H., Elbaz, D., et al. 2008,ApJ, 673, L21
Daddi, E., Bournaud, F., Walter, F., et al. 2010,ApJ, 713, 686
Daddi, E., Dannerbauer, H., Liu, D., et al. 2015,A&A, 577, A46
Danielson, A. L. R., Swinbank, A. M., Smail, I., et al. 2011,MNRAS, 410, 1687
Davies, R. I., Sternberg, A., Lehnert, M., & Tacconi-Garman, L. E. 2003,ApJ, 597, 907
Decarli, R., Walter, F., Aravena, M., et al. 2016,ApJ, 833, 70
Downes, D., & Solomon, P. M. 1998,ApJ, 507, 615
Downes, D., Radford, J. E., Greve, A., et al. 1992,ApJ, 398, L25
Fang, J. J., Faber, S. M., Koo, D. C., & Dekel, A. 2013,ApJ, 776, 63
Franx, M., van Dokkum, P. G., Förster Schreiber, N. M., et al. 2008,ApJ, 688, 770
Frerking, M. A., Keene, J., Blake, G. A., & Phillips, T. G. 1989,ApJ, 344, 311
Geach, J. E., Smail, I., Moran, S. M., et al. 2011,ApJ, 730, L19
Genzel, R., Förster Schreiber, N. M., Rosario, D., et al. 2014,ApJ, 796, 7
Genzel, R., Tacconi, L. J., Lutz, D., et al. 2015,ApJ, 800, 20
Gerin, M., & Phillips, T. G. 1998,ApJ, 509, L17
Glover, S. C. O., & Clark, P. C. 2016,MNRAS, 456, 3596
Grogin, N. A., Kocevski, D. D., Faber, S. M., et al. 2011,ApJS, 197, 35
Israel, F. P., Rosenberg, M. J. F., & van der Werf, P. 2015,A&A, 578, A95
Kaufman, M. J., Wolfire, M. G., Hollenbach, D. J., & Luhman, M. L. 1999,ApJ, 527, 795
Kauffmann, G., Heckman, T. M., White, S. D. M., et al. 2003,MNRAS, 341, 54
Kaufman, M. J., Wolfire, M. G., & Hollenbach, D. J. 2006,ApJ, 644, 283
Kirkpatrick, A., Pope, A., Sajina, A., et al. 2015,ApJ, 814, 9
Koekemoer, A. M., Faber, S. M., Ferguson, H. C., et al. 2011,ApJS, 197, 36
Kriek, M., van Dokkum, P. G., Franx, M., et al. 2007,ApJ, 669, 776
Lang, P., Wuyts, S., Somerville, R. S., et al. 2014,ApJ, 788, 11
Loenen, A. F., van der Werf, P. P., Güsten, R., et al. 2010,A&A, 521, L2 A11, page 9 of10
Luo, B., Brandt, W. N., Xue, Y. Q., et al. 2017,ApJS, 228, 2
Magdis, G. E., Daddi, E., Béthermin, M., et al. 2012a,ApJ, 760, 6
Magdis, G. E., Daddi, E., Sargent, M., et al. 2012b, ApJ, 758, L9
Magnelli, B., Popesso, P., Berta, S., et al. 2013,A&A, 553, A132
Malhotra, S., Kaufman, M. J., Hollenbach, D., et al. 2001,ApJ, 561, 766
Mannucci, F., Cresci, G., Maiolino, R., Marconi, A., & Gnerucci, A. 2010,
MNRAS, 408, 2115
Marsan, Z. C., Marchesini, D., Brammer, G. B., et al. 2015,ApJ, 801, 133
McMullin, J. P., Waters, B., Schiebel, D., Young, W., & Golap, K. 2007, in Astronomical Data Analysis Software and Systems XVI, eds. R. A. Shaw, F. Hill, & D. J. Bell, ASP Conf. Ser., 376, 127
Meier, D. S., Walter, F., Bolatto, A. D., et al. 2015,ApJ, 801, 63
Meijerink, R., & Spaans, M. 2005,A&A, 436, 397
Meijerink, R., Spaans, M., & Israel, F. P. 2007,A&A, 461, 793
Mihos, J. C., & Hernquist, L. 1994,ApJ, 437, L47
Momcheva, I. G., Brammer, G. B., van Dokkum, P. G., et al. 2016,ApJS, 225, 27
Nelson, E., van Dokkum, P., Franx, M., et al. 2014,Nature, 513, 394
Noeske, K. G., Weiner, B. J., Faber, S. M., et al. 2007,ApJ, 660, L43
Papadopoulos, P. P., Thi, W.-F., & Viti, S. 2004,MNRAS, 351, 147
Papovich, C., Labbé, I., Glazebrook, K., et al. 2016,Nature Astron., 1, 3
Pineda, J. L., & Bensch, F. 2007,A&A, 470, 615
Pineda, J. L., Mizuno, N., Röllig, M., et al. 2012,A&A, 544, A84
Popping, G., Behroozi, P. S., & Peeples, M. S. 2015a,MNRAS, 449, 477
Popping, G., Caputi, K. I., Trager, S. C., et al. 2015b,MNRAS, 454, 2258
Popping, G., Somerville, R. S., & Galametz, M. 2017, MNRAS, submitted
[arXiv:1609.08622]
Rodighiero, G., Daddi, E., Baronchelli, I., et al. 2011,ApJ, 739, L40
Roseboom, I. G., Oliver, S. J., Kunz, M., et al. 2010,MNRAS, 409, 48
Saintonge, A., Lutz, D., Genzel, R., et al. 2013,ApJ, 778, 2
Santini, P., Maiolino, R., Magnelli, B., et al. 2014,A&A, 562, A30
Scoville, N., Sheth, K., Walter, F., et al. 2015,ApJ, 800, 70
Scoville, N., Sheth, K., Aussel, H., et al. 2016,ApJ, 820, 83
Seko, A., Ohta, K., Yabe, K., et al. 2016,PASJ, 68, 62
Skelton, R. E., Whitaker, K. E., Momcheva, I. G., et al. 2014,ApJS, 214, 24
Solomon, P. M., & Vanden Bout, P. A. 2005,ARA&A, 43, 677
Spaans, M. 1996,A&A, 307, 271
Spilker, J. S, Bezanson, R., Marrone, D. P., et al. 2016,ApJ, 832, 19S
Stacey, G. J., Geis, N., Genzel, R., et al. 1991,ApJ, 373, 423
Tacconi, L. J., Neri, R., Chapman, S. C., et al. 2006,ApJ, 640, 228
Tacconi, L. J., Genzel, R., Smail, I., et al. 2008,ApJ, 680, 246
Tacconi, L. J., Genzel, R., Neri, R., et al. 2010,Nature, 463, 781
Tacconi, L. J., Neri, R., Genzel, R., et al. 2013,ApJ, 768, 74
Tadaki, K.-I., Genzel, R., Kodama, T., et al. 2017,ApJ, 834, 135
Tan, Q., Daddi, E., Sargent, M., et al. 2013,ApJ, 776, L24
van der Wel, A., Franx, M., van Dokkum, P. G., et al. 2014,ApJ, 788, 28
van Dokkum, P. G., Kriek, M., Rodgers, B., Franx, M., & Puxley, P. 2005,ApJ, 622, L13
van Dokkum, P. G., Bezanson, R., van der Wel, A., et al. 2014,ApJ, 791, 45
van Dokkum, P. G., Nelson, E. J., Franx, M., et al. 2015,ApJ, 813, 23
Wagg, J., Wilner, D. J., Neri, R., Downes, D., & Wiklind, T. 2006,ApJ, 651, 46
Walter, F., Weiß, A., Downes, D., Decarli, R., & Henkel, C. 2011,ApJ, 730, 18
Weiß, A., Downes, D., Henkel, C., & Walter, F. 2005,A&A, 429, L25
Wellons, S., Torrey, P., Ma, C.-P., et al. 2015,MNRAS, 449, 361
Whitaker, K. E., Franx, M., Leja, J., et al. 2014,ApJ, 795, 104
Whitaker, K. E., Franx, M., Bezanson, R., et al. 2015,ApJ, 811, L12
Whitaker, K. E., Bezanson, R., van Dokkum, P. G., et al. 2017, ApJ, submitted
[arXiv:1607.03107]
Williams, C. C., Giavalisco, M., Cassata, P., et al. 2014,ApJ, 780, 1
Wuyts, S., Förster Schreiber, N. M., van der Wel, A., et al. 2011,ApJ, 742, 96
Xue, Y. Q., Luo, B., Brandt, W. N., et al. 2011,ApJS, 195, 10
Zolotov, A., Dekel, A., Mandelker, N., et al. 2015,MNRAS, 450, 2327
Appendix A: The photometry for 3D-HST GS30274 adopted in the SED fitting
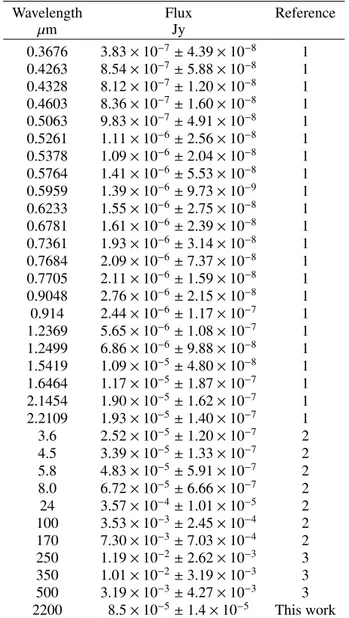
Table A.1. Photometry of 3D-HST GS30274 used for the SED fitting.
Wavelength Flux Reference
µm Jy 0.3676 3.83 × 10⁻⁷± 4.39 × 10⁻⁸ 1 0.4263 8.54 × 10⁻⁷± 5.88 × 10⁻⁸ 1 0.4328 8.12 × 10⁻⁷± 1.20 × 10⁻⁸ 1 0.4603 8.36 × 10⁻⁷± 1.60 × 10⁻⁸ 1 0.5063 9.83 × 10⁻⁷± 4.91 × 10⁻⁸ 1 0.5261 1.11 × 10⁻⁶± 2.56 × 10⁻⁸ 1 0.5378 1.09 × 10⁻⁶± 2.04 × 10⁻⁸ 1 0.5764 1.41 × 10⁻⁶± 5.53 × 10⁻⁸ 1 0.5959 1.39 × 10⁻⁶± 9.73 × 10⁻⁹ 1 0.6233 1.55 × 10⁻⁶± 2.75 × 10⁻⁸ 1 0.6781 1.61 × 10⁻⁶± 2.39 × 10⁻⁸ 1 0.7361 1.93 × 10⁻⁶± 3.14 × 10⁻⁸ 1 0.7684 2.09 × 10⁻⁶± 7.37 × 10⁻⁸ 1 0.7705 2.11 × 10⁻⁶± 1.59 × 10⁻⁸ 1 0.9048 2.76 × 10⁻⁶± 2.15 × 10⁻⁸ 1 0.914 2.44 × 10⁻⁶± 1.17 × 10⁻⁷ 1 1.2369 5.65 × 10⁻⁶± 1.08 × 10⁻⁷ 1 1.2499 6.86 × 10⁻⁶± 9.88 × 10⁻⁸ 1 1.5419 1.09 × 10⁻⁵± 4.80 × 10⁻⁸ 1 1.6464 1.17 × 10⁻⁵± 1.87 × 10⁻⁷ 1 2.1454 1.90 × 10⁻⁵± 1.62 × 10⁻⁷ 1 2.2109 1.93 × 10⁻⁵± 1.40 × 10⁻⁷ 1 3.6 2.52 × 10⁻⁵± 1.20 × 10⁻⁷ 2 4.5 3.39 × 10⁻⁵± 1.33 × 10⁻⁷ 2 5.8 4.83 × 10⁻⁵± 5.91 × 10⁻⁷ 2 8.0 6.72 × 10⁻⁵± 6.66 × 10⁻⁷ 2 24 3.57 × 10⁻⁴± 1.01 × 10⁻⁵ 2 100 3.53 × 10⁻³± 2.45 × 10⁻⁴ 2 170 7.30 × 10⁻³± 7.03 × 10⁻⁴ 2 250 1.19 × 10⁻²± 2.62 × 10⁻³ 3 350 1.01 × 10⁻²± 3.19 × 10⁻³ 3 500 3.19 × 10⁻³± 4.27 × 10⁻³ 3 2200 8.5 × 10⁻⁵± 1.4 × 10⁻⁵ This work Notes. The fluxes in this table were compiled from the follow-ing references: (1) Skelton et al. (2014, and references therein), (2)Magnelli et al.(2013), (3)Roseboom et al.(2010).

![Fig. 4. Moment zero maps of the band 4 continuum (top left), the CO J = 3–2 line (top right), the CO J = 4–3 line (bottom left), and the [CI] 1–0 line (bottom right)](https://thumb-eu.123doks.com/thumbv2/123dokorg/8100727.124916/6.892.61.839.117.732/fig-moment-continuum-right-line-left-line-right.webp)
![Fig. 5. Integrated flux density of the CO J = 3–2 (left), CO J = 4–3 (middle), and [CI] 1–0 (right) emission lines in 3D-HST GS30274](https://thumb-eu.123doks.com/thumbv2/123dokorg/8100727.124916/7.892.70.833.114.353/fig-integrated-flux-density-middle-right-emission-lines.webp)
![Table 3. H 2 mass, relative amount of H 2 , and H 2 depletion time of 3D-HST GS30274 derived by adopting the following approaches; [CI]: an H 2](https://thumb-eu.123doks.com/thumbv2/123dokorg/8100727.124916/8.892.177.716.181.272/table-relative-depletion-hst-derived-adopting-following-approaches.webp)