ANALYSIS OF SERUM TRANSTHYRETIN BY ON-LINE IMMUNOAFFINITY SOLID-PHASE EXTRACTION CAPILLARY ELECTROPHORESIS MASS
SPECTROMETRY USING MAGNETIC BEADS
Roger Peró-Gascón, Laura Pont, Fernando Benavente*, José Barbosa, Victoria Sanz-Nebot
Department of Analytical Chemistry, University of Barcelona, Barcelona, Spain
*Corresponding author: [email protected] (F. Benavente, PhD)
Tel: (+34) 934039778, Fax: (+34) 934021233
KEYWORDS: capillary electrophoresis / magnetic beads / mass spectrometry / on-line immunopurification / transthyretin
Non-standard abbreviations:
Ab: antibody. Amino acids:
Cys: cysteine. Glu: glutamic acid. Gly: glycine. Met: methionine.
BS3: bis(sulfosuccinimidyl)suberate.
EIE: extracted ion electropherogram.
FAP-I: familial amyloidotic polyneuropathy type I. HAc: acetic acid.
HFor: formic acid. IA: immunoaffinity. MB: magnetic bead. MeOH: methanol.
Mr: relative molecular mass.
MWCO: molecular weight cut-off. ProA: protein A.
PTM: post-translational modification. TIE: total ion electropherogram. tm: migration time.
TTR: transthyretin.
UV: ultraviolet spectrophotometry.
2 ABSTRACT
In this paper, an on-line immunoaffinity solid-phase extraction capillary electrophoresis mass spectrometry (IA-SPE-CE-MS) method using magnetic beads (MBs) is described for the analysis of serum transthyretin (TTR), which is a protein related to different types of amyloidosis. First, purification of TTR from serum was investigated by off-line immunoprecipitation and CE-MS. The suitability of three Protein A (ProA) MBs (Protein A Ultrarapid AgaroseTM (UAPA), Dynabeads® Protein A (DyPA) and SiMAG-Protein A (SiPA)) and AffiAmino Ultrarapid AgaroseTM (UAAF) MBs to prepare an IA sorbent with a polyclonal antibody (Ab) against TTR, was studied. In all cases results were repeatable and it was possible the identification and the quantitation of the relative abundance of the 6 most abundant TTR proteoforms. Although recoveries were the best with UAPA MBs, UAAF MBs were preferred for on-line immunopurification because Ab was not eluted from the MBs. Under the optimised conditions with standards in IA-SPE-CE-MS, microcartridge lifetime (>20 analyses/day) and repeatability (2.9 and 4.3 % RSD for migration times and peak areas) were good, the method was linear between 5- 25 µg·mL-1 and limit of detection (LOD) was around 1 µg·mL-1 (25 times lower than
by CE-MS, 25 µg·mL-1). A simple off-line sample pretreatment based on precipitation of the most abundant proteins with 5% (v/v) of phenol was necessary to clean-up serum samples. The potential of the on-line method to screen for familial amyloidotic polyneuropathy type I (FAP-I), which is the most common hereditary systemic amyloidosis, was demonstrated analysing serum samples from healthy controls and FAP-I patients.
3 1. Introduction
Capillary electrophoresis mass spectrometry (CE-MS) is nowadays a mature technique with many interesting application areas, especially those that require the highly efficient separation and characterisation of biomolecules, including peptides, protein isoforms, glycoforms, glycopeptides, protein-protein or drug-protein complexes [1–7]. However, the low concentration sensitivity for most analytes is very often a limitation that hinders a more widespread application [8–12]. The use of more selective and sensitive mass spectrometers is often not enough to decrease the limit of detection (LOD). Therefore, CE-MS has been often combined with different electrophoretic and chromatographic techniques for the on-line preconcentration of the target analytes after the injection of a large volume of sample, such as sample stacking, isotachophoresis or on-line solid phase extraction (SPE-CE) [10–14].
In SPE-CE, a microcartridge with an appropriate sorbent is inserted near the inlet of the separation capillary to preconcentrate and clean up the target analytes from a large volume of sample. As extraction occurs immediately before the electrophoretic separation without human handling, many pioneering authors in the field referred the coupling as “on-line” since the late 80s [8,9,15]. However, other authors have preferred the term “in-line” because the microcartridge is fully integrated with the separation capillary [10–12]. Both terms are actually coexisting in the literature, something that has generated some controversy [16,17]. SPE-CE-MS has been extensively explored using the silica or polymeric sorbents typically used in off-line SPE (e.g. C18) [11– 14,16,17], because of the versatility, the large active surface area, the compatibility with the on-line electrophoretic separation and detection and the commercial availability at a
4 reasonable price. However, the limited selectivity of such sorbents hinders very often the analysis of complex samples, such as biological fluids, even with MS detection [14,16,17]. Immunoaffinity (IA) sorbents are an interesting alternative with improved selectivity, which may provide excellent extraction efficiency if the immunoreactivity and orientation of the antibody (Ab) and the active surface area are optimum and non-specific adsorption is minimized [8,9,18,19]. However, in addition to the limited commercial availability of IA sorbents with the most appropriate features for IA-SPE-CE-MS, it is a challenge to make compatible IA sorbent stability, on-line immunoextraction and MS detection [18–22]. It is well-known that extreme ionic strength, high temperature and acidic or alkaline conditions may cause antibody denaturation. Furthermore, with on-line MS detection, solutions must be volatile to prevent salt build-up in the mass spectrometer. This is the reason why only a few authors have demonstrated IA-SPE-CE-MS with lab-made porous silica or agarose IA sorbents for the analysis of small peptides and proteins [18–22].
In the last decade, many different magnetic beads (MBs) have become commercially available with a wide range of surface chemistries to easily and reproducibly couple many types of microorganisms, cells or biological molecules, including Ab [23–25]. The robustness and versatility of the commercial MBs and the simplicity of operation are rapidly expanding the application areas, including IA-SPE-CE [26–33]. Since the pioneering work of Rashkovetsky et al [26], several authors have described the use of IA-MBs in capillary or microchip format with ultraviolet (UV) [27,31], fluorescence [26,28–30] or MALDI-MS [32,33] detection, but not yet with fully on-line ESI-MS detection. One of the great advantages of MBs in IA-SPE-CE is that facilitate the packing procedures and preparation of fritless microcartridges or microrreactors,
5 because permanent magnets or electromagnets can be used to trap or move the particles. Between the disadvantages, it is worth mentioning that in general many commercial MBs are not porous, which is a limitation for the active surface area, especially when the amount of sorbent is small such as in capillaries and microchannels. Furthermore, little is known about the influence of the biological molecules on the formation and retention of MB plugs in a capillary or a microdevice [34] or about the influence of the external magnetic field in the extraction procedures [35].
In this paper is described, for the first time to the best of our knowledge, an IA-SPE-CE-MS method using MBs. The method is applied to the analysis of serum TTR.TTR is a homotetramer composed of four identical monomers (MO) (relative molecular mass (Mr)14,000) with different proteoforms (isoforms and post-translational modifications
(PTMs)) [36–41]. TTR is known to misfold and aggregate as stable insoluble fibrils due to mutations and conformational changes, causing different neurodegenerative diseases known as amyloidosis [42,43]. Some of the 100 point mutations known in the TTR-gene are related to different types of hereditary TTR amyloidosis, such as familial amyloidotic polyneuropathy type I (FAP-I) [36,37,39,44]. FAP-I is associated with a TTR variant that presents a single amino acid substitution of valine for methionine at position 30 (Met 30). First, analysis of TTR from serum was investigated by off-line immunoprecipitation and CE-MS with different MBs derivatized with a polyclonal Ab. Later, on-line IA-SPE-CE-MS was optimised and the potential to screen rapidly and reliably for FAP-I was demonstrated analysing serum samples from healthy controls and FAP-I patients.
6 2. Materials and methods
2.1. Chemicals and reagents
All the chemicals used in the preparation of background electrolytes (BGEs) and solutions were of analytical reagent grade or better. Propan-2-ol (≥99.9%), methanol (≥99.9%), formic acid (HFor) (99.0%), acetic acid (HAc) (glacial), ammonia (25%), hydrochloric acid (25%), sodium hydrogenphosphate (≥99.0%), sodium chloride (≥99.5%), sodium hydroxide (≥99.0%), phenol (≥99.5%), potassium dihydrogenphosphate (≥99.0%), potassium chloride (99.0%), glycine (Gly) (99.7%) and TTR (≥95.0%) were purchased from Merck (Darmstadt, Germany). Tris(hydroxymethyl)aminomethane (Tris) (≥99.5%) was purchased from Baker (Deventer, Holland). Water (LC-MS grade) and acetonitrile (LC-MS grade) for sample pretratment and CE-MS experiments, and ammonium acetate (NH4Ac) (≥99.9%) were
supplied by Sigma (St. Louis, MO, USA). In the rest of experiments, water with a conductivity value lower than 0.05 µS·cm-1 was obtained using a Milli-Q water
purification system (Millipore, Molsheim, France).
Rabbit antihuman TTR polyclonal Ab was purchased from Dako (Glostrup, Denmark). The different MBs were provided by different manufacturers. Superparamagnetic agarose beads Protein A Ultrarapid AgaroseTM (UAPA) and AffiAmino Ultrarapid
AgaroseTM (UAAF) of 45-165 µm diameter were supplied by Lab on a Bead (Uppsala, Sweden). Superparamagnetic silica beads Dynabeads® Protein A (DyPA) of 2.8 µm diameter were purchased from Life Technologies (Carlsbad, CA, USA). Superparamagnetic silica particles SiMAG-Protein A (SiPA) of 1 µm diameter were
7 provided by Chemicell GmbH (Berlin, Germany). The crosslinker BS3
(bis(sulfosuccinimidyl)suberate) was purchased from Pierce Biotechnology (Rockford, IL, EUA).
2.2. Electrolyte solutions, sheath liquid, protein standards and serum samples.
The BGE for CE-MS separation contained 1 M HAc (pH 2.3) or 10 mM NH4Ac,
adjusted to pH 7.0 with ammonia, for off-line immunoprecipitation or on-line IA-SPE-CE, respectively. Both BGEs were passed through a 0.22 µm nylon filter (MSI, Westboro, MA, USA). The sheath liquid solution consisted of a mixture of 60:40 (v/v) propan-2-ol:water with 0.05% or 0.25% (v/v) of HFor for the acidic or the neutral BGEs, respectively. With the neutral BGE, the percentage of HFor in the sheath liquid was higher for optimum detection sensitivity of TTR [45]. The sheath liquid and the BGEs were degassed for 10 min by sonication before use.
An aqueous standard solution (1,000 µg·mL-1) of TTR was prepared and stored in a
freezer at -20ºC when not in use. Excipients of low Mr were removed from the sample
by passage through 10,000 Mr cut-off (MWCO) cellulose acetate filters (Amicon
Ultra-0.5, Millipore). The sample was centrifuged at 25ºC for 10 min at 11,000 x g and the
residue was washed three times for 10 min in the same way, with an appropriate volume of acidic BGE or phosphate buffered saline (PBS) (0.011 M sodium hydrogenphosphate, 0.0015 M potassium dihydrogenphospate, 0.14 M sodium chloride, 0.0027 M potassium chloride, pH 7.2) for off-line immunoprecipitation or IA-SPE-CE, respectively. The final residue was recovered by inverting the upper reservoir in a vial
8 and spinning once more at a reduced centrifugal force (2 min at 300 x g). Sufficient acidic BGE or PBS was added to adjust the concentration of TTR to 1,000 µg·mL-1.
Human blood samples from a healthy control and a symptomatic FAP-I patient were kindly supplied by the Hospital Universitari de Bellvitge (HUB, Hospitalet de Llobregat, Spain). The assay was approved by the Ethics Committee of the HUB and written informed consent was obtained from all participants in the study. Serum was prepared as described in our previous work [45]. Serum aliquots were stored in a freezer at -20ºC when not in use.
2.3. Apparatus and procedures
pH measurements were made with a Crison 2002 potentiometer and a Crison electrode 52-03 (Crison Instruments, Barcelona, Spain). Centrifugal filtration was carried out in a cooled Rotanta 460 centrifuge (Hettich Zentrifugen, Tuttlingen, Germany) for centrifugation at controlled temperature (4 or 25ºC). Agitation was performed with a Vortex Genius 3 (Ika®, Staufen, Germany). Neodymium block magnets (7 x 6 x 1.2 mm, N50) were supplied by Supermagnete (Gottmadingen, Germany). A neodymium cube magnet (12 mm, N48) was supplied by Lab on a Bead.
2.3.1. Off-line immunoprecipitation with MBs and CE-MS
Serum samples were immunopurified using the anti-TTR Ab coupled to the different MBs following the manufacturer’s instructions. First, the solvent of the commercial Ab solution (2,400 µg·mL-1) was changed to PBS by centrifugal filtration (as explained in
9 section 2.2 for the TTR standard). After that, 50 µL of MBs were vortexed and the supernatant was removed using a cube magnet to sediment the particles (magnetic separation). The MBs were washed with 100 µL of PBS twice and resuspended in 50 µL of PBS. 50 µL of Ab in PBS solution (2,400 µg·mL-1) were then added to the MBs suspension. The mixture was moderately shaken for 40 min at room temperature. The supernatant was removed by magnetic separation and the MBs were subsequently washed three times with 100 µL of PBS. Only for crosslinking of UAPA MBs a 100 mM BS3 in PBS stock solution was prepared immediately before use. A volume of 250 µL of a 30 mM BS3 solution prepared from the stock solution was added to the MBs suspension in PBS. The mixture was moderately shaken for 30 min at room temperature. Then, 13 µL of a 1 M Tris (pH 7.5) solution were added and the mixture was shaken for 15 min. The crosslinked UAPA MBs were washed and stored in PBS as indicated before.
For off-line immunoprecipitation of TTR, 50 (DyPA) or 75 µL (UAPA, UAAF and SiPA) of serum sample were added to the MBs, depending on the binding capacity declared by the manufacturer (0.24, >3, >0.5 and 5 mg Ab/mL MB, respectively), and the mixture was incubated for 20 min at room temperature with gentle orbital shaking. Again, the supernatant was removed and the MBs were then washed three times with 200 µL of PBS. Finally, in order to elute TTR, 50 µL of 50 mM glycine (adjusted to pH 2.8 with HCl) were added and the mixture was incubated for 5 min at room temperature with orbital shaking. The supernatant containing the eluted TTR was collected and transferred into a clean microcentrifuge vial. Non volatile components of low Mr were
removed by centrifugal filtration (see section 2.2) and solvent was changed to the acidic BGE for CE-MS. The protein samples were immediately analysed.
10 Fused silica capillaries were supplied by Polymicro Technologies (Phoenix, AZ, EUA). All CE-MS experiments were performed in an HP3D CE system coupled with an orthogonal G1603A sheath-flow interface to a 6220 oa-TOF LC/MS spectrometer (Agilent Technologies, Waldbronn, Germany). The sheath liquid was delivered at a flow rate of 3.3 µL·min-1 by a KD Scientific 100 series infusion pump (Holliston, MA,
USA). ChemStation and MassHunter softwares (Agilent Technologies) were used for CE and TOF mass spectrometer control, data acquisition, integration and m/z mass spectra deconvolution. The TOF mass spectrometer was operated under optimum conditions in positive mode using the following parameters: capillary voltage 4,000 V, drying gas temperature 300ºC, drying gas flow rate 4 L·min-1, nebulizer gas 7 psig,
fragmentor voltage 325 V, skimmer voltage 80 V, OCT 1 RF Vpp voltage 300 V. Data were collected in profile at 1 spectrum/s between 100 and 3,200 m/z, with the mass range set to high resolution mode (4 GHz).
Separations were performed at 25°C in a 72 cm long (LT) × 75 µm id × 365 µm od
capillary. All capillary rinses were performed at high pressure (930 mbar). New capillaries were flushed with 1 M NaOH (15 min), water (15 min) and BGE (30 min). The system was finally equilibrated by applying the 25 kV separation voltage (normal polarity, cathode in the outlet) for 15 min. Between workdays, the capillary was conditioned by rising successively with 0.1 M NaOH (5 min), water (10 min) and BGE (15 min). Both activation and conditioning procedures were performed off-line to avoid the unnecessary entrance of NaOH into the MS system. Samples were hydrodynamically injected at 50 mbar for 10 s. Between runs at 25 kV, capillary was
11 conditioned flushing at 930 mbar for 2 min with BGE, 1 min with H2O and 1 min with
BGE.
2.3.2. On-line IA-SPE-CE-UV and IA-SPE-CE-MS
These experiments were performed only with UAPA and UAAF MBs, which were derivatized with the Ab as explained in section 2.3.1. Each prepared IA-MB batch was stored in the fridge when not in use.
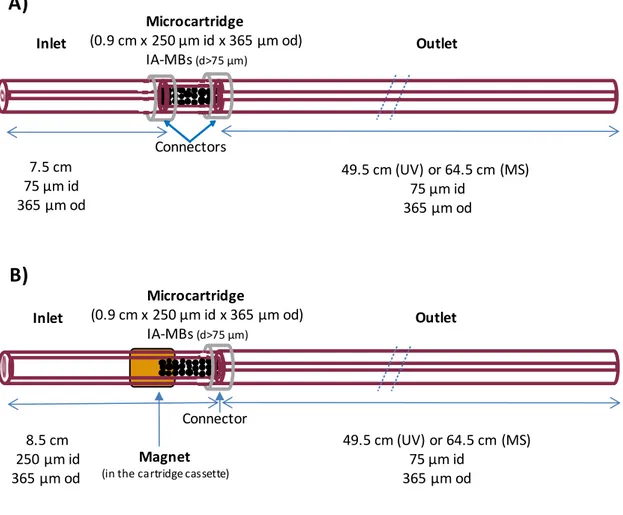
Construction of the IA microcartridge or analyte concentrator could be carried out as described elsewhere taking advantage of agarose MBs size [13,17] or their magnetic properties. In the first design, which is depicted in Figure 1-A, the microcartridge (0.9 cm LT × 250 µm id × 365 µm od capillary) was inserted using two plastic sleeves at 7.5
cm from the inlet of a previously conditioned separation capillary (75 µm id × 365 µm od x LT 57 or 72 cm, with UV and MS detection, respectively). It was filled before
connection by vacuum, and the IA-MBs were retained mostly due to particle size (>75 μm id capillary) hence neither frits nor magnet were required [17].In the second design, the 0.9 cm microcartridge was similarly constructed in one of the ends of an 8.5 cm LT
× 250 µm id × 365 µm capillary fragment (Figure 1-B). This capillary was connected with a plastic sleeve to the conditioned separation capillary (see dimensions above). A 12 mm cubic magnet helped during vacuum filling from the outlet end, since the particles were strongly retained and packed when they entered the strongly magnetised section in the end of the 250 µm id capillary. After this, the particles outside the 0.9 cm magnetised section were easily removed by applying vacuum in the opposite direction. The shift and loss of IA-MBs to the inlet vial during CE operation was prevented
12 placing a smaller block magnet (7 x 6 x 1.2 mm) in the cartridge cassette to maintain the particles in the microcartridge. As can be observed in Figure 1-B, the magnet did not need to cover the whole microcartridge body.
In all these experiments, the neutral BGE was used to avoid extreme pH that would cause Ab denaturation and protein elution. Capillaries were first conditioned flushing at 930 mbar for 2 min with BGE. TTR standards in PBS and serum samples were hydrodynamically introduced at 930 mbar for 10 min (75 and 60 µL with UV and MS detection, respectively, using the Hagen-Poiseuille equation [46]). A final rinse with BGE (2 min, 930 mbar) eliminated non-retained molecules and equilibrated the capillary before the electrophoretic separation. Under optimised conditions, an eluent of 100 mM NH4OH (pH 11.2) was injected at 50 mbar for 10 s (70 and 50 nL with UV and
MS detection, respectively [46]). For a rapid and quantitative protein elution, a 25 mbar pressure was applied for 150 s (i.e. BGE was introduced) before beginning the separation in order to guarantee that the elution plug passed through the IA-MBs [14]. With MS detection, all these steps were performed by switching off the nebulizer gas and the ESI capillary voltage to prevent non-volatile and contaminants entrance into the MS. Then, both were switched on and separation was carried out at 25°C and +25 kV (normal polarity). Between runs, to avoid carry-over the capillary was rinsed with 100 mM NH4Ac (pH 7.0) and water (2 min at 930 mbar both).
A simple off-line sample pretreatment was required to analyse TTR in serum samples to prevent microcartridge saturation and capillary inner surface damage due mostly to the presence of other high-abundance proteins, such as albumin. A method for the isolation of TTR from mouse serum and human cerebrospinal fluid was adapted [47,48]. At 2ºC,
13 8 mg of NaCl were added to 100 µL of human serum and then dropwise 100 µL of 5% (v/v) phenol. Most of the proteins precipitated and TTR remained in solution, which lost the yellowish colour of the serum. Under the optimised conditions, the supernatant was collected after centrifugation for 10 min at 11000 x g and then diluted 1:1 (v/v) with PBS before analysis.
2.3.3. Quality parameters
All quality parameters with MS detection were calculated from data obtained by measuring peak area and migration time (tm) from the extracted ion electropherogram
(EIE) of TTR proteoforms (considering the m/z of the most abundant molecular ions, i.e. ions with charges +16, +15, +14, +13).Repeatability was evaluated as the relative standard deviation (%RSD) of peak areas and tm. Linearity range was established by
analysing standard solutions of TTR at concentrations between 1 and 50 µg·mL-1. An estimation of the LODs was obtained by analysing low-concentration standard solutions of TTR (close to the LOD level, as determined from the approach based on S/N=3). The lifetime of the microcartridges was evaluated by repeatedly analysing a standard solution of TTR at a concentration of 10 µg·mL-1 and pretreated human serum samples.
3. Results and discussion
3.1. Off-line immunoprecipitation with MBs and CE-MS
The performance for TTR purification of all the MBs was investigated first by off-line immunoprecipitation and CE-MS with a 1.0 M HAc (pH 2.3) BGE. We selected three
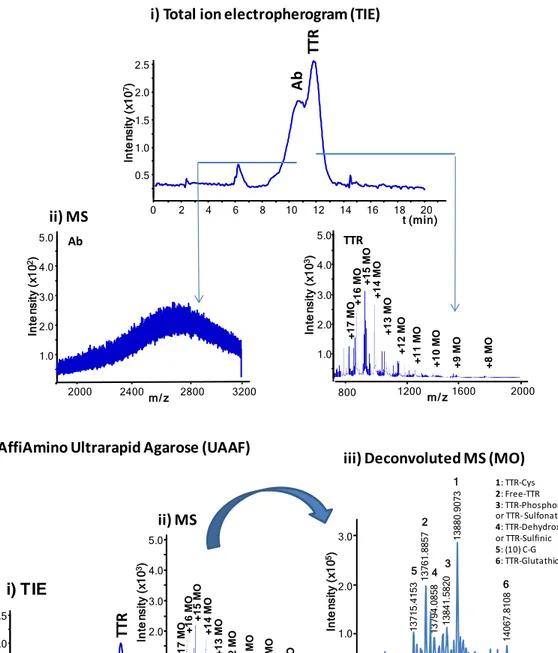
14 ProA MBs with different particle size and binding capacity from three manufacturers (UAPA, DyPA and SiPA) because Protein A strongly interacts with the Fc portion of the Ab (IgG) allowing an optimum Ab orientation. However, as there is no covalent bond between the Ab and the MBs, the elution conditions are typically harsh enough to elute the Ab together with the antigenic protein (e.g. 50 mM Gly-HCl (pH 2.8) in our case). As an alternative to the ProA MBs we also investigated UAAF MBs, which are functionalized with amino-reactive groups and covalently bound to the Ab without a preferred orientation. TTR was purified from serum samples by off-line immunoprecipitation and analysed by CE-MS. The relative recoveries (referred to the highest one) and repeatabilities (as %RSD, n=6) were calculated under the different conditions taking into account the peak area of the most abundant TTR proteoform (TTR-Cys, see Table 1). These values were 100% (2.3%), 80% (5.0%), 16% (4.3%) for UAPA, SiPA and DyPA, respectively and 52% (4.6%) for UAAF. The best recoveries were obtained with UAPA and SiPA MBs which presented the highest binding capacity (>3 and 5 mg Ab/mL MB, respectively), but in both cases the Ab was eluted with TTR and could be detected by CE-MS (see the electropherogram and mass spectra for UAPA in Figure 2-A). In contrast, recoveries were slightly lower with UAAF MBs but the antibody was not detected (Figure 2-B). In all cases, results were repeatable and the same TTR proteoforms were detected with similar relative abundances. As an example, Figure 2-B shows the mass spectrum (ii) and the deconvoluted mass spectrum (iii), using UAAF MBs. Table 1 shows information about the detected proteoforms for monomeric (MO) TTR, the relative error (Er) for experimental Mr, the relative
abundance (%A) and its %RSD. Mass accuracy was good (Er < 60 ppm), as well as %A
repeatability (%RSD<5.7%). The detected proteoforms agreed with those reported by other authors [36–41,45]. Furthermore, the method allowed detecting TTR forms found
15 at low concentration. This is the case, for example of TTR-Glutathione that presented a %A of 21% compared to TTR-Cys, which was the most abundant proteoform. However, it is important to note that mass accuracy was not enough to differentiate between the Phosphorylated and Sulfonated (N=3, Table 1) or between TTR-Dehydroxylated or TTR-Sulfinic (N=4, Table 1) proteoforms, which were neither separated by electrophoresis. In these cases, reliability of the identification would improve running -MS and -MS/MS experiments using mass spectrometers with improved mass accuracy and resolution.
Although, reliable and repeatable results were obtained, the off-line method was time-consuming, it could not be automated and it was relatively expensive considering the amount of IA-MBs consumed in each analysis and that they were not reused. As an alternative to solve these issues, we investigated the on-line immunopurification.
3.2. On line IA-SPE-CE-UV and IA-SPE-CE-MS
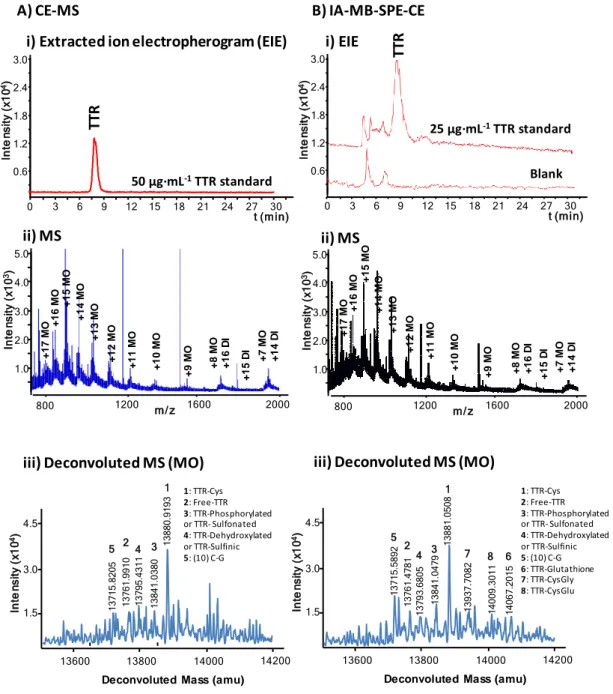
As we mentioned before, in all these experiments a neutral BGE was used because the acidic BGE would cause Ab denaturation and protein elution during capillary conditioning [18–22]. In our previous work [45], we showed that this neutral BGE allowed detecting by CE-MS the same TTR proteoforms than the acidic BGE, but sensitivity was lower. For ease of comparison later with on-line IA-SPE-CE-MS, Figure 3-A shows the EIE , the mass spectrum and the deconvoluted mass spectrum for a 50 µg·mL-1 TTR standard using the neutral BGE by CE-MS. As can be seen in the deconvoluted mass spectrum (Figure 3-A (iii)), only five of the six TTR proteoforms that were previously observed in serum with the acidic BGE (Figure 2-B (iii)) were
16 detected because this concentration was close to the LOD (≈25 µg·mL-1 of TTR in
standards).
3.2.1. IA-SPE-CE-UV
Some preliminary studies that were performed with UAPA and UAAF MBs and UV detection demonstrated that TTR standards needed to be dissolved in PBS, because TTR was not retained when dissolved in water or neutral BGE. PBS is a solution with a similar osmolarity and ion concentration to the human body fluids and probably benefited the interaction between TTR and the Ab. The performance of the two microcartridge designs depicted in Figure 1-A and –B was similar. However, the second one (Figure 1-B) had several remarkable advantages, such asthe presence of only one capillary connection and the simplicity to fill with MBs. These features increased the robustness and reusability of the system, because facilitated vacuum packing and particle replacement by removing the block magnet and applying pressure.
With regard to the volatile eluent, based on our experience, two acidic, 100 mM HAc (pH 2.9) and 50mM:50 mM HAc:HFor (pH 2.3), and a basic eluent, 100 mM NH4OH
(pH 11.2), were tested. When using UAPA MBs, TTR was eluted with all three eluents. However, repeatability was poor and TTR recovery diminished after several injections due to the gradual elution of the Ab. Crosslinking of UAPA MBs with BS3 was studied
in order to covalently bound the Ab to the ProA to avoid Ab elution. Nevertheless, crosslinked UAPA MBs did not allow detecting TTR by CE-MS, probably because antigen-binding site was modified and the Ab lost its function. The performance of the acidic eluents was also extremely poor with UAAF MBs because no TTR or Ab peaks
17 were detected and the sorbent was irreversibly damaged for subsequent analyses with the basic eluent (repeatability was low, analysis time increased and TTR peak area decreased). When using UAAF MBs and the basic eluent, the Ab was not eluted and results for TTR were good. A higher amount than 100 mM of NH4OH in the eluent was
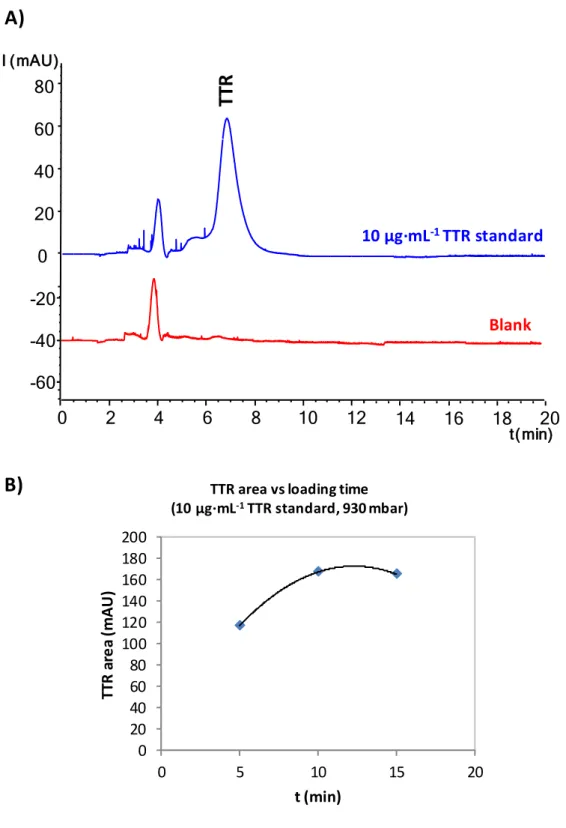
not tested to prevent Ab denaturation and expand the sorbent lifetime. The UV electropherograms of on-line preconcentration of TTR standards in PBS showed two peaks, the first related to the solvent and the second to TTR (Figure 4-A). In order to avoid carry-over, the postconditioning washing time with 100 mM NH4Ac (pH 7.0) and
water needed to be increased until 2 minutes.
Sample loading time was studied loading a 10 µg·mL-1 TTR standard solution at 930
mbar for 5, 10 and 15 min. As can be seen in Figure 4-B, a loading time of 10 min was selected for the rest of experiments because peak area of the eluted TTR was maximum. At 15 min protein breakthrough during sample loading caused a decrease of peak area. Under the optimised conditions, consecutives analyses of TTR standards were repeatable in terms of tm and peak area (%RSD (n=3) 4.3 and 4.6%, respectively, for a
10 µg·mL-1 TTR standard). LOD was around 2 µg·mL-1 and the method was linear (r2>0.99) between 5 and 25 µg·mL-1.
3.2.2. IA-SPE-CE-MS
The optimised method with UV detection was evaluated with MS detection, but needed a small adjustment because TTR was sometimes eluted as a double peak. Several alternatives were explored to improve TTR elution. First, organic modifiers were added to the basic eluent, for example a 10% (v/v) of MeOH, but still two TTR peaks were
18 detected. Next, a larger basic elution plug of 40 s at 50 mbar was tested but TTR peak broadened. Finally, the solution to reproducibly elute TTR as a single peak was to apply a 25 mbar pressure for 150 s after the elution plug injection and before beginning the separation in order to guarantee that the elution plug passed through the IA-MBs [14]. Figure 3-B shows theEIE, the mass spectrum and the deconvoluted mass spectrum for a 25 µg·mL-1 TTR standard, a concentration close to the LOD by CE-MS with the neutral
BGE. Compared to the CE-MS electropherogram of a 50 µg·mL-1 TTR standard shown in Figure 3-A preconcentration was significant. However, taking into account the volume of sample loaded on-line (60 µL) recoveries were much lower than previously with the off-line method, probably due to the limited amount of sorbent, smaller Ab-TTR ratio and the shorter interaction time. Figure 3-B shows that at 25 µg·mL-1 with the
on-line method three extra proteoforms were detected (TTR-glutathione, TTR-CysGly and TTR-CysGlu). As shown in Table 2, only at a concentration of 1000 µg·mL-1 of TTR the number of detected proteoforms by CE-MS was similar than by IA-SPE-CE-MS, as well as the mass accuracy (Er) and repeatability (%RSD %A). The increase of
the %A for the different proteoforms in IA-SPE-CE-MS, which was referred to TTR-Cys, could be related to the lower recovery of TTR-Cys compared to the rest of proteoforms. Under the optimised conditions, results were repeatable in terms of tm and
peak area (TTR-Cys %RSD (n=3) 2.9 and 4.3%, respectively), LOD was around 1 µg·mL1 (25 times lower than by CE-MS, ≈25 µg·mL-1) and the method was linear (r2>0.99) between 5 and 25 µg·mL-1. The lifetime of the microcartridges was superior to
20 analyses during the same day. After that, peak areas decreased until no detecting TTR due to sorbent deterioration. Something similar happened, even after a smaller number of analyses, if capillaries were stored overnight in the fridge or at room temperature, even filled with PBS.
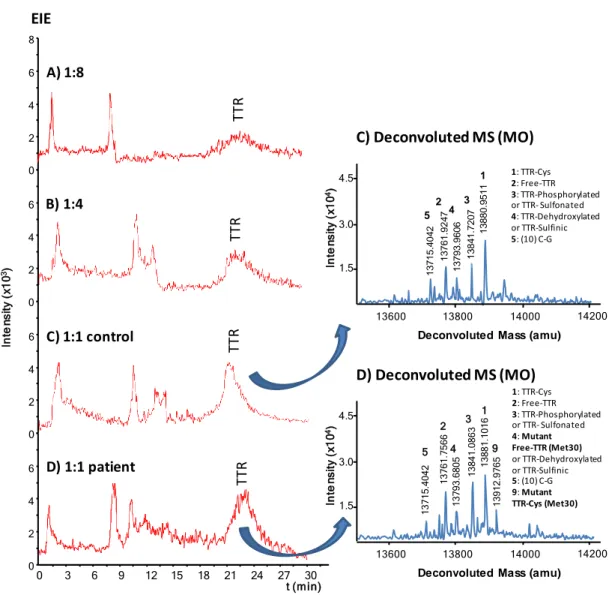
19 The on-line method optimised with standards was applied to the analysis of TTR in serum samples. Loading of serum samples without any pretreatment was not possible because of current instability and breakage. Several off-line sample pretreatments were studied in order to prevent microcartridge saturation and capillary inner surface damage due to the loading of salts and other high-abundance proteins, such as albumin. Serum filtration (0.22 µm pore) and dilution with water or PBS (1:1 or 1:10 (v/v)) or protein precipitation with acetonitrile, were not useful. Finally we applied a very simple method of protein precipitation with 5% (v/v) of phenol that allowed excellent TTR recoveries (around 90% from comparison of CE-MS analysis of a serum sample pretreated and desalted with 10,000 MWCO filters and a 250 µg·mL-1 TTR standard) [47,48]. Figures
5 A-C show the EIEs of the supernatant collected for a serum sample from a healthy control diluted 1:8, 1:4 and 1:1 (v/v) with PBS, respectively. As can be observed, TTR was detected at around 22 minutes and the largest peak was obtained in the less diluted sample. Furthermore, a small amount of albumin was still detected between 8 and 14 minutes in all cases. In this regard, the increase in tm of TTR with serum samples
compared to standards (Figure 3-B) was probably due to the modification of the inner wall of the separation capillary induced during loading by the remaining proteins that were not retained by the Ab. This modification was permanent, because TTR was also detected at this tm when a standard was analysed after a serum sample. Anyway, results
were repeatable in terms of tm and peak area (TTR-Cys %RSD (n=3) were 4.7 and
3.2%, respectively, for a 1:1 (v/v) serum sample). In diluted 1:4 and 1:8 (v/v) samples only three of the main TTR proteoforms were detected (data not shown). In contrast, the five most abundant TTR proteoforms were detected in the 1:1 (v/v) sample (Figure 5-C), with similar figures of merit (Table 3-A) compared to the TTR standard (Table
2-20 B). For the 1:1 (v/v) dilution, the lifetime of the microcartridges was lower than for TTR standard solutions (>10 vs >20 analyses during the same day) due to the higher sample matrix complexity The on-line method was finally applied to the analysis of a serum sample from an FAP-I patient. Figure 5-D shows the EIE and the deconvoluted mass spectrum of TTR in the FAP-I patient serum sample. Table 3-B shows the information about the detected proteoforms, which are very similar to those obtained for the healthy control. As can be observed, all the main normal TTR proteoforms were detected as well as the main mutant proteoforms (TTR-Cys (Met30) and Free-TTR (Met30)). However, the mass spectrometer mass accuracy was not enough to differentiate between mutant free-TTR (Met30), TTR-Dehydroxylated or TTR-Sulfinic (N=4, Table 3). Therefore, although the %A corresponding to these three proteoforms in the FAP-I patient was higher than the summed contribution of the two normal proteoforms in the healthy control (table 3), only detection of the TTR-Cys (Met30) proteoform would unambiguously confirm the TTR amyloidosis.
4. Concluding remarks
We have developed a method for purification, separation and characterization of TTR from serum samples by off-line immunoprecipitation with UAPA MBs and CE-MS with an acidic BGE. In order to minimize sample manipulation, increase analysis throughput and reduce consumption of IA-MBs, while maintaining the reproducibility and reliability of the method, we have also developed a novel on-line IA-SPE-CE-MS method. Although recoveries were the best with UAPA MBs in the off-line method, UAAF MBs were preferred for the on-line immunopurification because Ab was not eluted from the MBs. Under the optimised conditions with standards, migration times
21 and peak areas were repeatable (%RSD<5%), microcartridge lifetime was good (>10 (serum samples) and >20 (standards) analyses/day), the method was linear between 5 and 25 µg·mL-1 and LOD was 25 times lower (1 µg·mL-1) than in CE-MS (25 µg·mL-1). Finally, the potential of the on-line method to screen serum samples for FAP-I was confirmed after developing a simple off-line clean-up pretreatment based on protein precipitation with 5% (v/v) of phenol. In view of our experience and the results achieved, MBs offer a powerful alternative to expand the applicability of on-line IA-SPE-CE and an excellent opportunity to engage unskilled operators interested in IA or other type of sorbents. For example, we are currently exploring if the magnetic microcartridge design (Figure 1-B) can be applied to prepare frits with chemically inert MBs to pack non-magnetic sorbents (e.g. a conventional C18).
Acknowledgements
This study was supported by a grant from the Spanish Ministry of Economy and Competitiveness (CTQ2014-56777-R). We also thank Dr. C. Casasnovas and Dr. M. A. Alberti (Hospital Universitari de Bellvitge, HUB, Hospitalet de Llobregat, Spain) for providing the blood samples.
The authors have declared no conflict of interest.
References
[1] Klepárník, K., Electrophoresis 2015, 36, 159–178. [2] Štěpánová, S., Kašička, V., J. Sep. Sci. 2015, in press. [3] Kašička, V., Electrophoresis 2014, 35, 69–95.
[4] Heemskerk, A. A. M., Deelder, A. M., Mayboroda, O. A., Mass Spectrom. Rev. 2014, 1–13.
22 [6] Haselberg, R., de Jong, G. J., Somsen, G. W., Electrophoresis 2013, 34, 99–112. [7] Wenz, C., Barbas, C., López-Gonzálvez, Á., Garcia, A., Benavente, F.,
Sanz-Nebot, V., Blanc, T., Freckleton, G., Britz-McKibbin, P., Shanmuganathan, M., de l’Escaille, F., Far, J., Haselberg, R., Huang, S., Huhn, C., Pattky, M., Michels, D., Mou, S., Yang, F., Neusuess, C., Tromsdorf, N., Baidoo, E. E. K., Keasling, J. D., Park, S. S., J. Sep. Sci. 2015, 38, 3262–3270.
[8] Guzman, N. A., Blanc, T., Phillips, T. M., Electrophoresis 2008, 29, 3259–78. [9] Guzman, N. A., Phillips, T. M., Electrophoresis 2011, 32, 1565–1578.
[10] Breadmore, M. C., Tubaon, R. M., Shallan, A. I., Phung, S. C., Keyon, A. S. A., Gstoettenmayr, D., Prapatpong, P., Alhusban, A. A., Ranjbar, L., See, H. H., Dawod, M., Quirino, J. P., Electrophoresis 2015, 36, 36–61.
[11] Ramautar, R., Somsen, G. W., de Jong, G. J., Electrophoresis 2014, 35, 128–37. [12] Ramautar, R., Somsen, G. W., de Jong, G. J., Electrophoresis 2015, in press. [13] Benavente, F., Vescina, M. C., Hernández, E., Sanz-Nebot, V., Barbosa, J.,
Guzman, N. A., J. Chromatogr. A 2007, 1140, 205–212.
[14] Medina-Casanellas, S., Benavente, F., Barbosa, J., Sanz-Nebot, V.,
Electrophoresis 2011, 32, 1750–9.
[15] Guzman, N. A., Trebilcock, M. A., Advis, J. P., J. Liq. Chromatogr. 1991, 14, 997–1015.
[16] Hernández, E., Benavente, F., Sanz-Nebot, V., Barbosa, J., Electrophoresis 2008, 29, 3366–3376.
[17] Medina-Casanellas, S., Tak, Y. H., Benavente, F., Sanz-Nebot, V., Sastre Toraño, J., Somsen, G. W., de Jong, G. J., Electrophoresis 2014, 35, 2996–3002. [18] Medina-Casanellas, S., Benavente, F., Barbosa, J., Sanz-Nebot, V., Anal. Chim.
Acta 2012, 717, 134–142.
[19] Medina-Casanellas, S., Benavente, F., Barbosa, J., Sanz-Nebot, V., Anal. Chim.
Acta 2013, 789, 91–99.
[20] Guzman, N. A., J. Chromatogr. B. Biomed. Sci. Appl. 2000, 749, 197–213. [21] Giménez, E., Benavente, F., de Bolós, C., Nicolás, E., Barbosa, J., Sanz-Nebot,
V., J. Chromatogr. A 2009, 1216, 2574–82.
[22] Medina-Casanellas, S., Benavente, F., Giménez, E., Barbosa, J., Sanz-Nebot, V.,
Electrophoresis 2014, 35, 2130–2136.
[23] Plouffe, B. D., Murthy, S. K., Lewis, L. H., Rep. Prog. Phys. 2014, 78, 016601. [24] Tekin, H. C., Gijs, M. A. M., Lab Chip 2013, 13, 4711.
[25] van Reenen, A., de Jong, A. M., den Toonder, J. M. J., Prins, M. W. J., Lab Chip 2014, 14, 1966.
[26] Rashkovetsky, L. G., Lyubarskaya, Y. V., Foret, F., Hughes, D. E., Karger, B. L., J. Chromatogr. A 1997, 781, 197–204.
[27] Kaneta, T., Inoue, J., Koizumi, M., Imasaka, T., Electrophoresis 2006, 27, 3218–23.
23 [28] Chen, H.-X., Busnel, J.-M., Peltre, G., Zhang, X.-X., Girault, H. H., Anal. Chem.
2008, 80, 9583–8.
[29] Stege, P. W., Raba, J., Messina, G. A., Electrophoresis 2010, 31, 3475–81. [30] Tennico, Y. H., Remcho, V. T., Electrophoresis 2010, 31, 2548–57.
[31] Morales-Cid, G., Diez-Masa, J. C., de Frutos, M., Anal. Chim. Acta 2013, 773, 89–96.
[32] Gasilova, N., Gassner, A.-L., Girault, H. H., Electrophoresis 2012, 33, 2390–8. [33] Gasilova, N., Girault, H. H., Anal. Chem. 2014, 86, 6337–45.
[34] Henken, R. L., Chantiwas, R., Gilman, S. D., Electrophoresis 2012, 33, 827–33. [35] Moliner-Martínez, Y., Prima-Garcia, H., Ribera, A., Coronado, E.,
Campíns-Falcó, P., Anal. Chem. 2012, 7233−7240.
[36] Ando, Y., Ueda, M., Curr. Med. Chem. 2012, 19, 2312–2323.
[37] Poulsen, K., Bahl, J. M. C., Tanassi, J. T., Simonsen, A. H., Heegaard, N. H. H.,
Methods 2012, 56, 284–292.
[38] Nakanishi, T., Sato, T., Sakoda, S., Yoshioka, M., Shimizu, A., Biochim.
Biophys. Acta 2004, 1698, 45–53.
[39] Terazaki, H., Ando, Y., Suhr, O., Ohlsson, P. I., Obayashi, K., Yamashita, T., Yoshimatsu, S., Suga, M., Uchino, M., Ando, M., Biochem. Biophys. Res.
Commun. 1998, 249, 26–30.
[40] Horvatovich, P., Franke, L., Bischoff, R., J. Proteome Res. 2014, 13, 5–14. [41] Gericke, B., Raila, J., Sehouli, J., Haebel, S., Könsgen, D., Mustea, A.,
Schweigert, F. J., BMC Cancer 2005, 5, 133–141.
[42] Falk, R. H., Comenzo, R. L., Skinner, M., N. Engl. J. Med. 1997, 337, 898–909. [43] Johnson, S. M., Connelly, S., Fearns, C., Powers, E. T., Kelly, J. W., J. Mol.
Biol. 2012, 421, 185–203.
[44] Connors, L. H., Lim, A., Prokaeva, T., Roskens, V. A., Costello, C. E., Amyloid
J. Protein Fold. Disord. 2003, 10, 160–184.
[45] Pont, L., Benavente, F., Barbosa, J., Sanz-Nebot, V., Electrophoresis 2015, 36, 1265–1273.
[46] Lauer, H. H., Rozing, G. P., Eds. , High Performance Capillary Electrophoresis, Agilent Technologies, Germany, 2014.
[47] Reuter, A. M., Hamoir, G., Marchand, R., Kennes, F., Eur. J. Biochem. 1968, 5, 233–238.
24 49.5 cm (UV) or 64.5 cm (MS) 75 µm id 365 µm od Inlet Connectors 7.5 cm 75 µm id 365 µm od Microcartridge (0.9 cm x 250 µm id x 365 µm od) IA-MBs (d>75 µm) Outlet
A)
8.5 cm 250 µm id 365 µm od 49.5 cm (UV) or 64.5 cm (MS) 75 µm id 365 µm od Connector OutletB)
Inlet Magnet(in the cartridge cassette)
Microcartridge
(0.9 cm x 250 µm id x 365 µm od) IA-MBs (d>75 µm)
Figure 1. Representations of the microcartridge designs A) UAPA or UAAF MBs are trapped in a microcartridge body of 250 µm id due to their particle size and B) UAPA or UAAF MBs are retained in one of the ends of a piece of 250 µm id capillary and a magnet prevents the shift and loss of the MBs. (The first design could not be applied with SyPA and DyPA MBs because both are very small. Similarly, in the second case the magnet should cover the whole microcartridge body).
25 B) AffiAmino Ultrarapid Agarose (UAAF)
1: TTR-Cys 2: Free-TTR 3: TTR-Phosphorylated or TTR- Sulfonated 4: TTR-Dehydroxylated or TTR-Sulfinic 5: (10) C-G 6: TTR-Glutathione
iii) Deconvoluted MS (MO)
1.0 2.0 3.0
D e convoluted Mass (amu) 13600 13800 14000 14200 13 88 0.9 07 3 13 76 1. 88 57 13 84 1. 58 20 13 71 5. 41 53 13 79 4. 08 58 In te ns ity ( x1 0 5) 5 4 3 1 2 14 06 7. 81 08 6 i) TIE 0.5 1.0 1.5 2.0 2.5 2 4 6 8 10 12 14 16 18 20 t (min) In te ns ity ( x1 0 7) TTR 0 m/z 1.0 2.0 3.0 4.0 5.0 1600 2000 In te ns ity ( x1 0 3) 1200 800 +1 5 MO +1 6 MO +1 4 MO +1 7 MO +1 3 MO +1 2 MO +1 1 MO +9 MO +1 0 MO ii) MS A) Protein A Ultrarapid Agarose (UAPA)
0.5 1.0 1.5 2.0 2.5 2 4 6 8 10 12 14 16 18 20 t (min) In te ns ity ( x1 0 7) TTR 0 Ab
i) Total ion electropherogram (TIE)
m/z 1.0 2.0 3.0 4.0 5.0 1600 2000 In te ns ity ( x1 0 3) 1200 800 +1 5 MO +1 6 MO +1 4 M O +1 7 MO +1 3 MO +1 2 MO +1 1 MO +8 MO +9 MO +1 0 MO TTR Ab m/z 1.0 2.0 3.0 4.0 5.0 2000 2400 2800 3200 In te ns ity ( x1 0 2) ii) MS
Figure 2. CE-MS using 1 M HAc as BGE after the off-line immunoprecipitation of a healthy control serum sample using A) UAPA and B) UAAF MBs. (i) Total ion electropherogram (TIE), (ii) mass spectrum and (iii) deconvoluted mass spectrum. (Ab: antibody; MO: monomer).
26 A) CE-MS B) IA-MB-SPE-CE +8 MO +1 6 D I +7 MO +1 4 D I 0.6 1.2 1.8 2.4 3.0 3 6 9 12 15 18 21 24 27 30 t (min) In te ns ity ( x1 0 4) TTR 0 i) EIE Blank 25 µg·mL-1TTR standard m/z 1.0 2.0 3.0 4.0 5.0 1600 2000 In te ns ity ( x1 0 3) 1200 800 +1 5 MO +1 6 MO +1 4 MO +1 7 MO +1 3 MO +1 2 MO +1 1 MO +9 MO +1 0 MO ii) MS 1: TTR-Cys 2: Free-TTR 3: TTR-Phosphorylated or TTR- Sulfonated 4: TTR-Dehydroxylated or TTR-Sulfinic 5: (10) C-G 6: TTR-Glutathione 7: TTR-CysGly 8: TTR-CysGlu
iii) Deconvoluted MS (MO)
1.5 3.0 4.5
Deconvoluted Mass (amu)
13600 13800 14000 14200 In te ns ity ( x1 0 4) 3 13 88 1. 05 08 13 76 1. 47 81 13 84 1.0 47 9 13 71 5. 58 92 13 79 3. 68 05 5 4 1 2 13 93 7. 70 82 7 14 06 7. 20 15 8 14 00 9.3 01 1 6 m/z 1.0 2.0 3.0 4.0 5.0 1600 2000 In te ns ity ( x1 0 3) 1200 800 +1 5 MO +1 6 MO +1 4 MO +1 7 MO +1 3 MO +1 2 MO +1 1 MO +9 MO +1 0 MO ii) MS +8 MO +1 6 D I +7 M O +1 4 D I
iii) Deconvoluted MS (MO)
1.5 3.0 4.5
Deconvoluted Mass (amu)
13600 13800 14000 14200 In te ns ity ( x1 0 4) 3 4 1 2 1388 0. 91 93 13 76 1. 99 10 13 84 1. 03 80 13 79 5. 43 11 13 71 5. 82 05 5 1: TTR-Cys 2: Free-TTR 3: TTR-Phosphorylated or TTR- Sulfonated 4: TTR-Dehydroxylated or TTR-Sulfinic 5: (10) C-G 0.6 1.2 1.8 2.4 3.0 3 6 9 12 15 18 21 24 27 30 t (min) In te ns ity ( x1 0 4) TTR 0
i) Extracted ion electropherogram (EIE)
50 µg·mL-1TTR standard +1 5 D I +1 5 D I
Figure 3. A) CE-MS for a 50 µg·mL-1 TTR standard using 10 mM NH
4Ac (pH 7.0) as
BGE. B) IA-SPE-CE-MS for a 25 µg·mL-1 TTR standard using UAAF MBs. (i) Total ion electropherogram (TIE), (ii) mass spectrum and (iii) deconvoluted mass spectrum. (MO: monomer; DI: dimer).
27 0 20 40 60 80 100 120 140 160 180 200 0 5 10 15 20 TT R a re a (m A U ) t (min) TTR area vs loading time (10 µg·mL-1TTR standard, 930 mbar)
B)
A)
0 2 4 6 8 10 12 I (mAU) -60 0 20 40 60 80TTR
-20 -40 10 µg·mL-1TTR standard t(min) 14 16 18 Blank 20Figure 4. A) IA-SPE-CE-UV for a 10 µg·mL-1 TTR standard using UAAF MBs and 100 mM NH4OH as eluent. B) Study of sample loading time at 930 mbar on the peak
28 TTR 1.0 2.0 3.0 4.0 5.0 3 6 9 12 15 18 21 24 27 30 t (min) Intensi ty (x10 3) 0 D) 2 1 4 1 3 8 8 0 .9 5 1 1 1 3 7 6 1 .9 2 4 7 1 3 8 4 1 .7 2 0 7 1 3 7 1 5 .4 0 4 2 1 3 7 9 3 .9 6 0 6 3 5 C) Deconvoluted MS (MO) 1.5 3.0 4.5
Deconvoluted Mass (amu)
13600 13800 14000 14200 In te ns ity ( x1 0 4) 1: TTR-Cys 2: Free-TTR 3: TTR-Phosphorylated or TTR- Sulfonated 4: TTR-Dehydroxylated or TTR-Sulfinic 5: (10) C-G TTR TTR In te ns ity ( x1 0 3) 3 6 9 12 15 18 21 24 27 30 t (min) 0 TTR 2 4 6 8 0 2 4 6 0 2 4 6 0 2 4 6 0 TTR A) 1:8 B) 1:4 C) 1:1 control D) 1:1 patient EIE 2 1 4 13 88 1. 10 16 13 76 1. 75 66 13 84 1.0 86 3 13 79 3. 68 05 3 9 13 91 2.9 76 5 13 71 5. 40 42 5 D) Deconvoluted MS (MO) 1.5 3.0 4.5
Deconvoluted Mass (amu)
13600 13800 14000 14200 In te ns ity ( x1 0 4) 1: TTR-Cys 2: Free-TTR 3: TTR-Phosphorylated or TTR- Sulfonated 4: Mutant Free-TTR (Met30) or TTR-Dehydroxylated or TTR-Sulfinic 5: (10) C-G 9: Mutant TTR-Cys (Met30)
Figure 5. IA-SPE-CE-MS for serum samples pretreated with 5% (v/v) phenol solution. The supernatants of the healthy controls and the FAP-I patient samples were diluted with PBS A) 1:8, B) 1:4 C) 1:1 and D) 1:1 (v/v). In C) and D) are shown the TTR deconvoluted mass spectra.
29 Table 1. Theoretical and deconvoluted average Mr and relative abundance for the detected TTR proteoforms of a healthy control serum sample
by off-line immunoprecipitation with UAAF MBs and CE-MS (BGE: 1M HAc, pH 2.3).
Off-line immunoprecipitation and CE-MS
N Detected monomer TTR proteoforms Theoretical Average Mr Deconvoluted Average Mr %Ab) (%RSD) Experimental Era) (ppm) 1. TTR-Cys 13880.4022 13880.9073 36 100 (3.4) 2. Free-TTR 13761.2640 13761.8857 45 64 (2.0) 3. TTR-Phosphorylated 13841.2439 13841.5820 24 40 (4.0) or TTR-Sulfonated 13841.3283 10 4. TTR-Dehydroxylated or TTR-Sulfinic 13793.2628 13794.0858 60 33 (5.7) 5. (10) C-G 13715.1713 13715.4153 18 33 (4.8) 6. TTR-Glutathione 14066.9600 14067.8108 60 21 (4.7)
a) Relative error (Er) was calculated in ppm as: |Mr exp – Mr theo|/Mr theo × 106 (exp = experimental and theo = theoretical).
30 Table 2. Theoretical and deconvoluted average Mr and relative abundance for the detected proteoforms of a 1000 µg·mL-1 TTR standard by
CE-MS and 25 µg·mL-1 TTR standard by IA-SPE-CE-MS with UAAF MBs (BGE: 10 mM NH4Ac, pH 7.0).
A) CE-MS B) IA-SPE-CE-MS N Detected MO TTR proteoforms Theoretical Average Mr Deconvoluted Average Mr %Ab) (%RSD) Deconvoluted Average Mr %Ab) (%RSD) Experimental Era) (ppm) Experimental Era) (ppm) 1. TTR-Cys 13880.4022 13880.9192 37 100 (1.6) 13881.0508 47 100 (4.3) 2. Free-TTR 13761.2640 13762.4781 53 41 (0.5) 13761.7772 37 62 (0.9) 3. TTR-Phosphorylated 13841.2439 13841.0308 15 35 (3.0) 13841.0479 41 60 (2.6) or TTR-Sulfonated 13841.3283 21 43 4. TTR-Dehydroxylated or TTR-Sulfinic 13793.2628 13793.8311 41 37 (2.9) 13793.6805 30 53 (1.9) 5. (10) C-G 13715.1713 13715.8205 47 35 (5.9) 13715.5892 30 62 (4.0) 6. TTR-Glutathione 14066.9600 14067.3258 26 20 (5.4) 14067.2015 17 35 (1.7) 7. TTR-CysGly 13937.4541 13938.2189 55 32 (4.9) 13937.7082 18 48 (2.2)
8. TTR-CysGlu 14009.5177 Not detected - - 14009.3011 15 27 (5.3)
a) Relative error (Er) was calculated in ppm as: |Mr exp – Mr theo|/Mr theo × 106 (exp = experimental and theo = theoretical).
31 Table 3. Theoretical and deconvoluted average Mr and relative abundance for the detected TTR proteoforms in serum samples pretreated with
5% (v/v) phenol solution (dilution 1:1 (v/v)) by IA-SPE-CE-MS (BGE: 10 mM NH4Ac, pH 7.0).
a) Relative error (Er) was calculated in ppm as: |Mr exp – Mr theo|/Mr theo × 106 (exp = experimental and theo = theoretical).
b) The relative abundance (%A) was calculated normalizing to the area value of the most abundant form.
A) Healthy control B) FAP-I patient N Detected MO TTR proteoforms Theoretical Average Mr Deconvoluted Average Mr %Ab) (%RSD) Deconvoluted Average Mr %Ab) (%RSD) Experimental Era) (ppm) Experimental Era) (ppm) 1. TTR-Cys 13880.4022 13880.9511 40 100 (3.2) 13881.1016 50 100 (4.0) 2. Free-TTR 13761.2640 13761.9247 48 64 (2.5) 13761.7566 36 61 (3.2) 3. TTR-Phosphorylated 13841.2439 13841.7207 34 69 (1.3) 13841.0863 22 67 (2.8) or TTR-Sulfonated 13841.3283 28 24
4. Mutant Free-TTR (Met30) 13793.3301 Not detected - -
13793.6805 25 64 (3.7) or TTR-Dehydroxylated or TTR-Sulfinic 13793.2628 13793.9606 51 51 (3.9) 30 5. (10) C-G 13715.1713 13715.4042 17 53 (2.8) 13715.4228 18 47 (4.8) 9. Mutant TTR-Cys (Met30) 13912.4683 Not detected - - 13912.9765 37 44 (3.8)